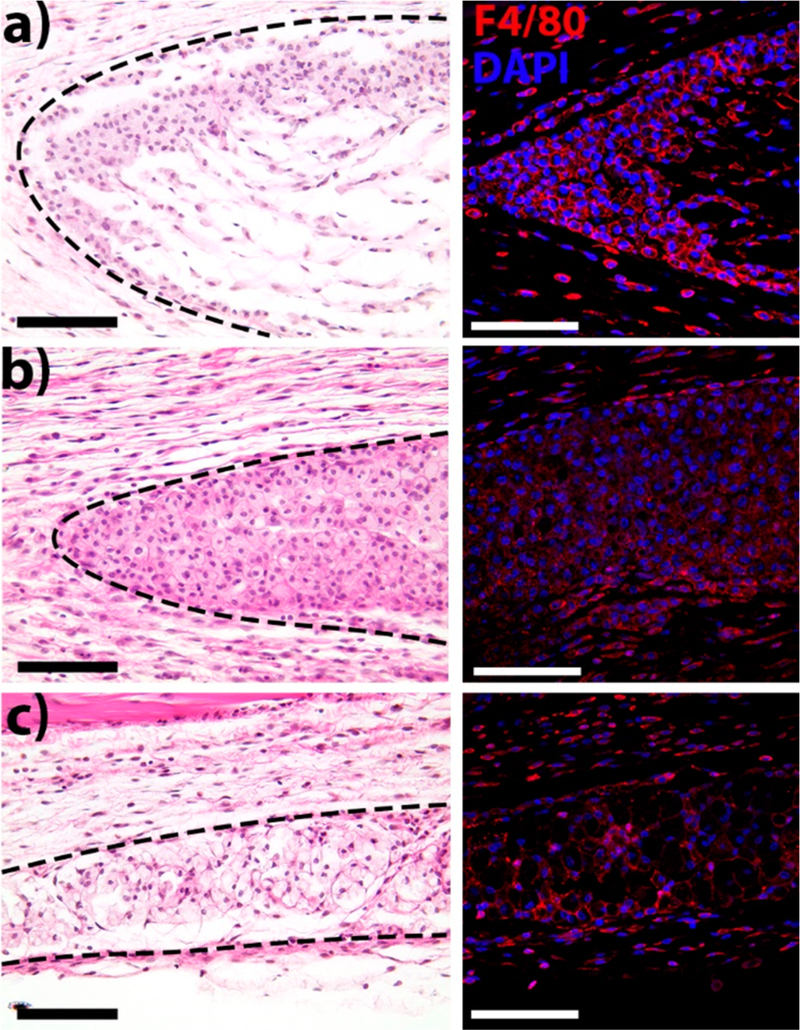
Figure 7.

H&E and immunofluorescent staining of subcutaneous implants of O5 hydrogel. (a) Day 3, (b) day 7, and (c) day 14. After implantation, the hydrogel is infiltrated by macrophages (F4/80+ cells, red; nuclei, blue) which degrade the material and remodel the native tissue. By day 14, the implant size decreases and new collagen is observed similar to native tissue (Figures S9 and S10). Scale bar is 100 μm. Dotted line indicates borders of the hydrogel implant.
