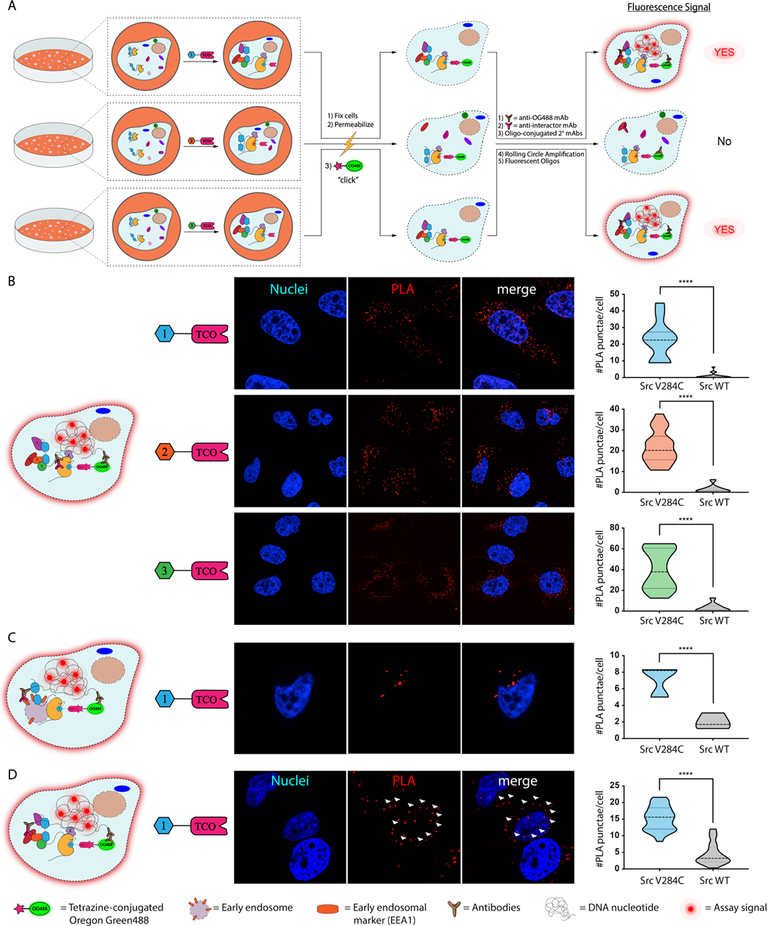
Figure 6.
Clickable proximity ligation assays (PLAs) with TCO-conjugated probes. (A) A schematic representation of PLAs performed with TCO-conjugated probes. Cells are treated with a TCO-conjugated probe, fixed, permeabilized, and then treated with a tetrazine-containing Oregon Green488 (OG488) dye. Fixed cells are then subjected to a standard proximity ligation assay protocol. (B) PLA for visualization of a probe-bound target. Representative images (nuclei in blue and PLA signal in red) of cells from three biological replicates are shown (middle). Quantified signals for the number of PLA-mediated fluorescent puncta observed per cell are shown in the violin plot (right). Values shown are the means of fluorescent puncta per cell from three biological replicates. (number of total cells quantified: n=97 for 1-TCO/Src V284C, and n=215 for 1-TCO/Src WT; n=148 for 2-TCO/Src V284C, and n=171 for 2-TCO/Src WT; n=142 for 3-TCO/Src V284C, and n=179 for 3-TCO/Src WT). (C) Clickable PLA for visualizing the cellular localization of TCO probe-bound Src in HeLa cells incubated in complete medium (DMEM). Representative images (nuclei in blue and PLA signal in red) of TCO probe-treated Src V284C-expressing HeLa cells are shown (middle). Quantified signals for the number of PLA-mediated fluoscent puncta observed per cell are shown in the violin plot (right). Values shown are the means of fluorescent puncta per cell from three biological replicates (number of total cells quantified: n=66 for Src V284C, and n=39 for Src WT). (D) Clcikable PLA for visualizing the interaction between Src and FAK. Representative images (nuclei in blue and PLA signal in red) of TCO probe-treated Src V284C-expressing HeLa cells plated on fibronectin are shown. The arrows (white) indicated examples of plasma membrane localization. Quantified signals for the number of PLA-mediated fluoscent puncta observed per cell are shown in the violin plot (right). Values shown are means of PLA puncta per cell from three biological replicates (number of total cells quantified: n= 375 for Src V284C, and n=314 for Src WT).

