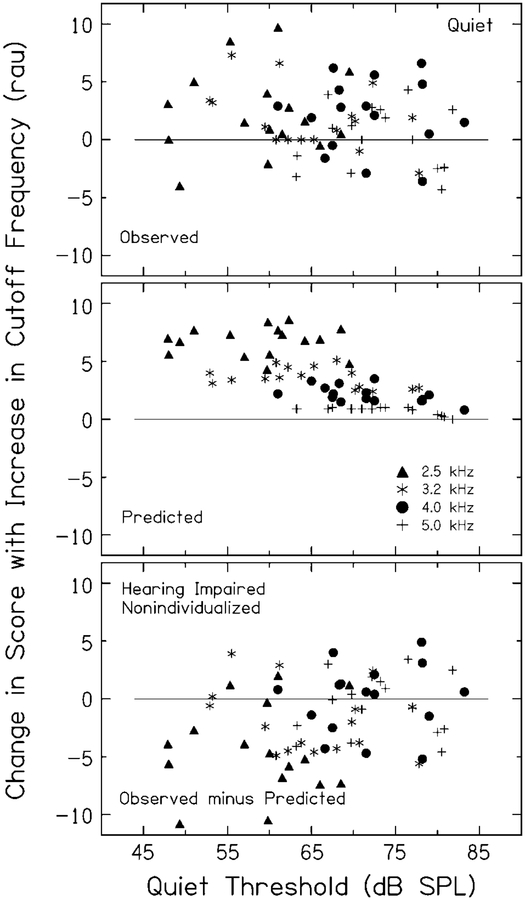
Figure 4.
For each HI participant listening to speech in quiet processed with the nonindividualized gain-frequency response, changes in score (in rau) with each additional third-octave band of speech are plotted in each panel as a function of the participant’s quiet threshold at the center frequency of that band. The triangle, asterisk, circle, and plus symbols represent data for thresholds measured and bands centered at 2.5, 3.2, 4.0, and 5.0 kHz, respectively. In some cases, multiple data points fall in the same location, resulting in fewer than 16 visible data points per condition. The top panel shows results for observed score changes. The middle panel shows results for predicted score changes. The bottom panel shows results for observed minus predicted score changes.

