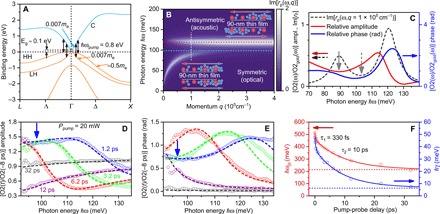
Fig. 2. Ultrafast dynamics of coupled surface plasmon-polaritons.

(A) Schematic of the electronic band structure of Hg0.81Cd0.19Te along several high-symmetry directions in the Brillouin zone without taking into account small intrinsic doping present in our samples. On the basis of the data in (40), C, HH, and LH denote the electron conduction band, heavy-hole, and light-hole valence band, respectively. Quasi-linear ultrarelativistic segments of band structure near Γ result from a large spin-orbit coupling. Vertical arrows show the optical transitions accessible to the optical pump with a photon energy of 0.8 eV. Note that the LH-C transitions have a much lower joint density of states than HH-C. The bandgap in this compound is ≈0.05 to 0.1 eV at 300 K and substantially temperature dependent (1). Effective masses of low-energy charge-carriers are indicated. (B) Imaginary part of the reflection coefficient rp(ω, q) as a function of frequency ω and in-plane momentum transfer q calculated for a 90-nm thin film of Hg0.81Cd0.19Te on top of CdTe substrate, as described in the text. The two surface modes expected in a thin metallic film (one per interface; red and cyan dashed lines) experience mutual repulsion at long wavelengths due to the coupling between the symmetric and antisymmetric charge oscillations in these modes. (C) Near-field amplitude (red) and phase (blue) calculated using the reflection coefficient in (B) in the lightning rod model of near-field sample-tip interaction referenced to those of gold. The black dashed line is a cut of Im[rp(ω, q)] at q0 = 1/100 nm = 105 cm−1 [white dashed line in (B)]. The gray vertical arrows indicate the depression in the near-field amplitude (solid) and Im[rp(ω, q0)] (dashed) between the two branches of the surface plasmon-polariton. (D and E) Photon energy dependence of the amplitude (D) and phase (E) of the normalized transient near-field signal demodulated at the second harmonic of the tip tapping frequency, presented for select pump-probe delays (open symbols). Arrows indicate the location of the secondary plasmon-polaritonic feature. Dashed lines are the result of a fit using the model dielectric function in Eq. 1 incorporated into the multilayer response of the Hg0.81Cd0.19Te thin film on a CdTe substrate. (F) Unscreened plasma frequency ωpl and scattering rate γ of plasmon-polariton quasiparticles as a function of the pump-probe delay (open symbols), extracted from the fit in (D) and (E). Red and blue solid lines in (F) are the result of a biexponential fit of the dependence of the plasma frequency and scattering rate, respectively, on the pump-probe delay. Horizontal red and blue dashed lines indicate the residual plasma frequency and scattering rate due to long-lived quasiparticle response (>30-ps lifetime).
