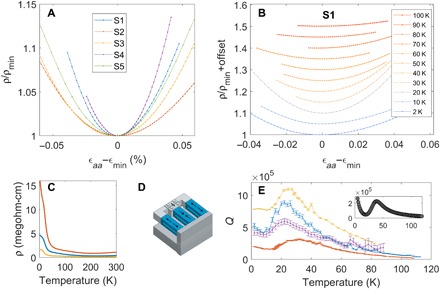
Fig. 2. Temperature and strain dependence of resistivity of ZrTe5.

(A) Strain dependence of resistivity of ZrTe5 at T = 2 K for five samples S1 to S5. A clear minimum in resistivity can be seen for each sample. The resistivity is normalized by its minimum value ρmin, which varies between 1 and 16 milli-Ohm⋅cm. The x axis is the strain along the a lattice direction, which is estimated on the basis of the method described in Materials and Methods. (B) Resistivity versus strain for temperatures between 2 and 100 K. A clear minimum can be seen for the entire temperature range. (C) Resistivity versus temperature for three ZrTe5 crystals S1 to S3, as measured before gluing onto the three-piezo strain apparatus. (D) Three-piezostack apparatus used to deliver strain. (E) Quadratic coefficient Q obtained from fitting . The sensitivity of the response to strain shows a nonmonotonic temperature dependence, as discussed in the main text. Inset: Coefficient Q computed using Boltzmann transport equations (Materials and Methods). The main calculated features agree with the experimental data: A local minimum then maximum is seen with increasing temperature. The relative strength and temperature of these features depend on the carrier density input into the model (see Materials and Methods for more information).
