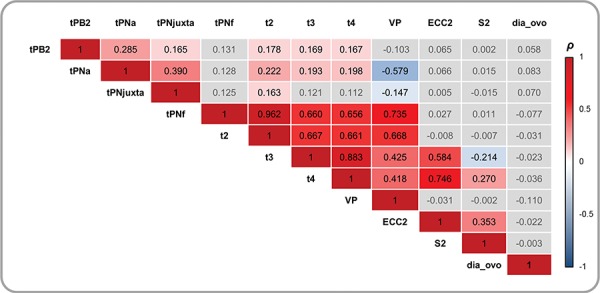
Figure 2.

Correlations between quantitative variables (oocyte diameter and fertilisation/embryonic timings), Spearman’s correlation test (ρ). Grey boxes represent non-significant coefficients. tPB2, time of polar body (PB) 2 emission; tPNa, the time of appearance of the two pronuclei with the distinction between the female (identified as the one near the site of emission of the PBII) and male PN; tPNjuxta, the time of PN juxtaposition; tPNf, the time of pronuclear fade out; t2, t3, t4, the time to reach 2, 3, 4 cells; VP, the time period in which the pronuclei were visible; ECC2, the time period of the second cell cycle (t4-t2); S2, the time period to complete synchronous divisions (t4-t3).
