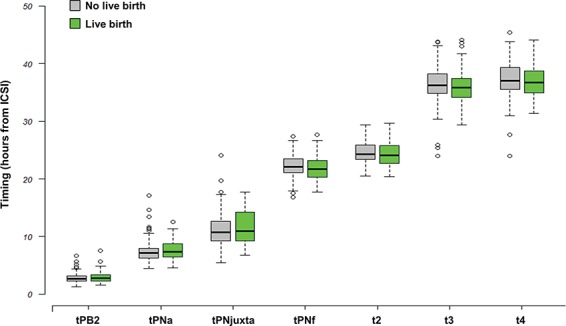
Figure 3.

Timing of morphokinetics events occurring during early embryo development according to the live birth outcome. Boxes represent the interquartile range (IQR). Lines inside the boxes are the median. Whiskers represent the lowest datum still within 1.5 IQR of the lower quartile, and the highest datum still within 1.5 IQR of the upper quartile. tPB2, time of PB; 2 emission; tPNa, the time of appearance of the two pronuclei with the distinction between the female (identified as the one near the site of emission of the PBII) and male PN; tPNjuxta, the time of PN juxtaposition; tPNf, the time of pronuclear fade out; t2, t3, t4, the time to reach 2, 3, 4 cells.
