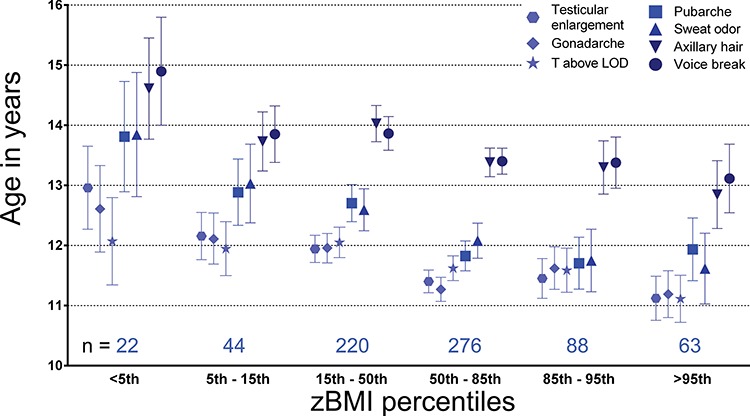
Figure 2.

Timing of pubertal events across the BMI spectrum (percentiles). Dots/boxes/triangles/stars represent mean age at event-based analysis in both cross-sectional and longitudinal samples. Lines extend to 95% CI. N per sex- and age-specific BMI score (BMI z-score: zBMI) group are indicated above the x-axis.
