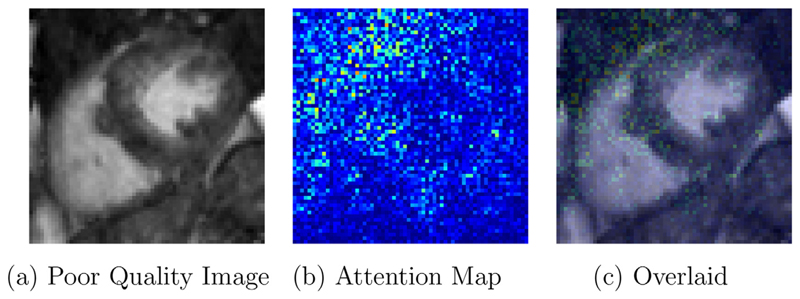
Fig. 11.
Attention map for a poor quality image learned by the last layer of the network, where red indicates high attention and blue low attention. The network architecture captures the area of significance for correctly classifying the image. Results provided for LRCN network trained with curriculum learning. (For interpretation of the references to colour in this figure legend, the reader is referred to the web version of this article.)

