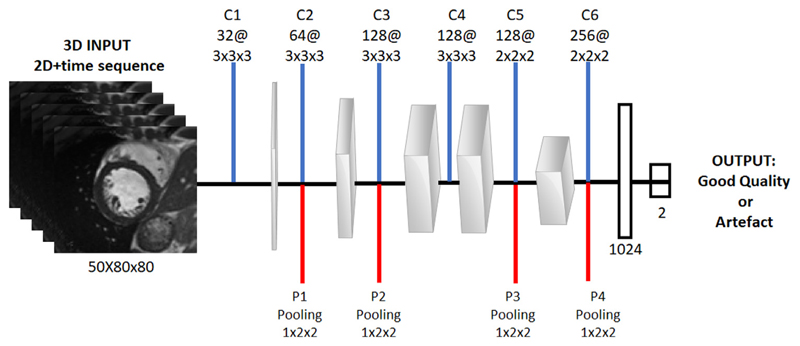
Fig. 3.
The 3-dimensional CNN architecture for motion artefact detection. Blue lines represent convolution operations and red lines correspond to the pooling operations following convolutional layers at each layer. The final two layers are densely connected layers of 1024 and 2 nodes respectively. (For interpretation of the references to colour in this figure legend, the reader is referred to the web version of this article.)

