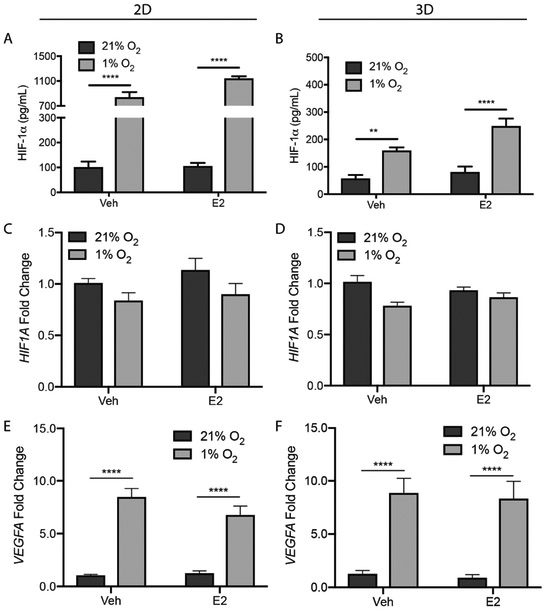
Fig. 3.
2D and 3D T47D cultures under normoxic (21% O2) or hypoxic (1% O2) conditions in E2-deprived (Veh) or E2-supplemented (E2) medium for 24 h, and then probed with ELISA to quantify HIF-1α protein levels (A, B). Protein levels were normalized to β-actin. Data represent the average ± SEM, from n ≥ 12 replicate cultures from three different cell passages. Total RNA was extracted, and the relative expression of HIF1A (C, D) and VEGFA (E, F) for each experimental condition determined using the ΔΔCt method; β-actin served as the reference gene. Data represent the average ± SEM, from n = 9 replicate cultures from a total of three passages of cells. *p ≤ 0.05, ** p ≤ 0.01, *** p ≤ 0.001, **** p ≤ 0.0001.

