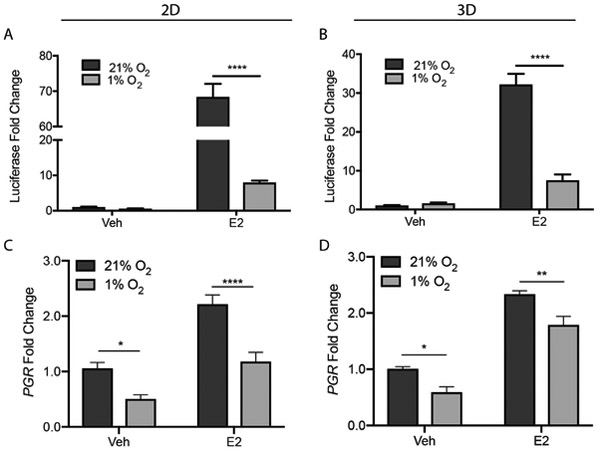
Fig. 5.
ERα transcriptional activation is reduced under hypoxic conditions in both 2D and 3D culture formats. Both culture formats were incubated in E2-deprived (Veh) or -supplemented (E2) medium under normoxic or hypoxic conditions for 24 h. Luciferase activity was quantified using the ONE-Glo luciferase assay; the fold-change in luminescence relative to E2-deprived cultures under normoxia was plotted for 2D (A) and 3D (B) culture formats. Figures represent the average ± SEM, from n ≥ 6 replicates from three different cell passages. Total RNA was extracted and the relative expression of PGR mRNA (C, D) was determined using the ΔΔCt method; β-actin served as the reference gene. Data represent the average ± SEM, from n = 9 replicate cultures from three different cell passages *p ≤ 0.05, ** p ≤ 0.01, *** p ≤ 0.001, **** p ≤ 0.0001.

