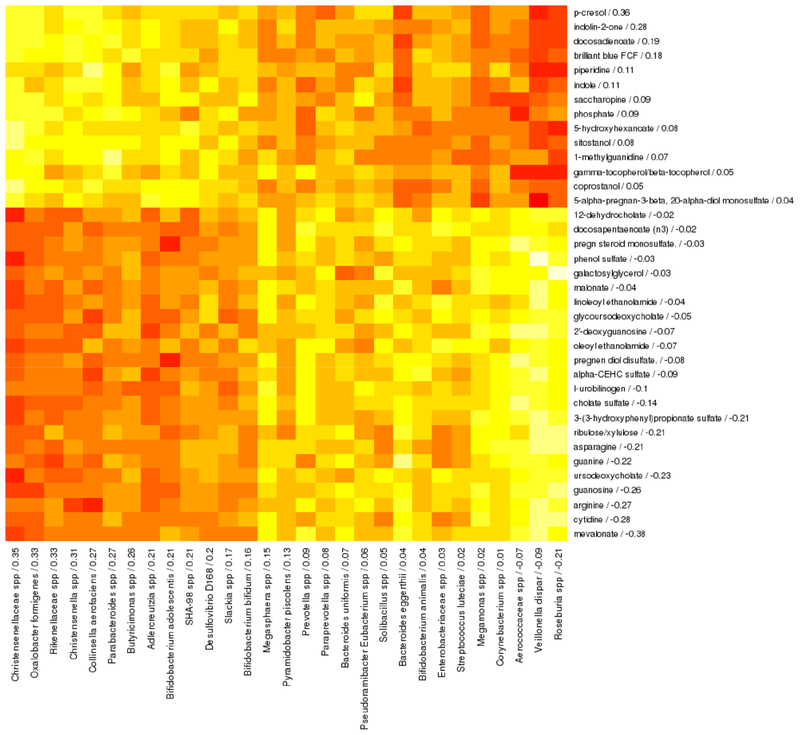
Figure 3. Spearman correlation heatmap of intestinal metabolites (rows) and intestinal bacterial taxa (columns) that are correlated with each other and with asthma at age 3 years in sparse canonical correlation analysis.
Canonical loadings are given for each feature after the feature name, with higher loadings indicating greater contribution to the canonical variate and sign indicating direction of association. Red indicates negative correlations and yellow indicates positive correlations. This analysis included 273 subjects with both plasma and stool metabolomics data available.

