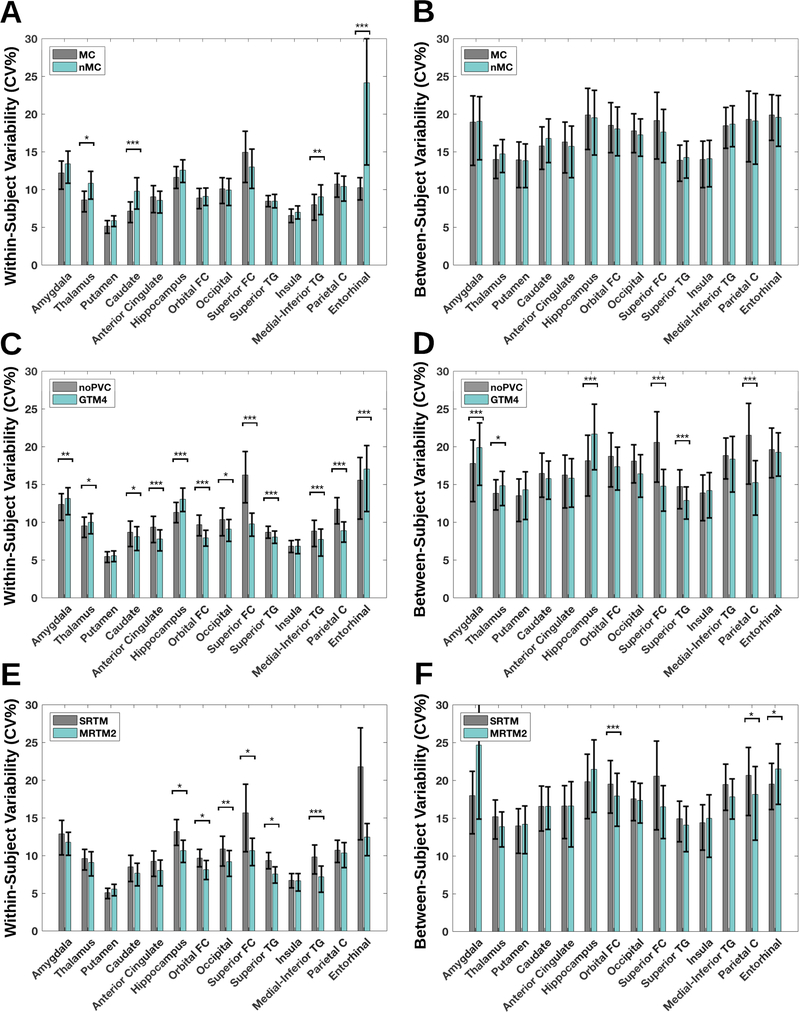
Figure 6:
(A) within-subject variability for 14 regions with or without motion correction, including a 95% confidence interval (B) between-subject variability for 14 regions with or without motion correction, including a 95% confidence interval (C-D) similar to A and B, but with either no partial volume correction (noPVC) or with the Geometric Transfer Matrix (GTM) and a point spread function assumption of 4 mm (E-F) similar to A and B, but with the application of either the Simplified Reference Tissue Model (SRTM) or the Multilinear Reference Tissue Model 2 (MRTM2) as kinetic modeling choice. * P < 0.05, ** P < 0.01, *** P < 0.001, FDR corrected for multiple comparisons (FDR=0.05).

