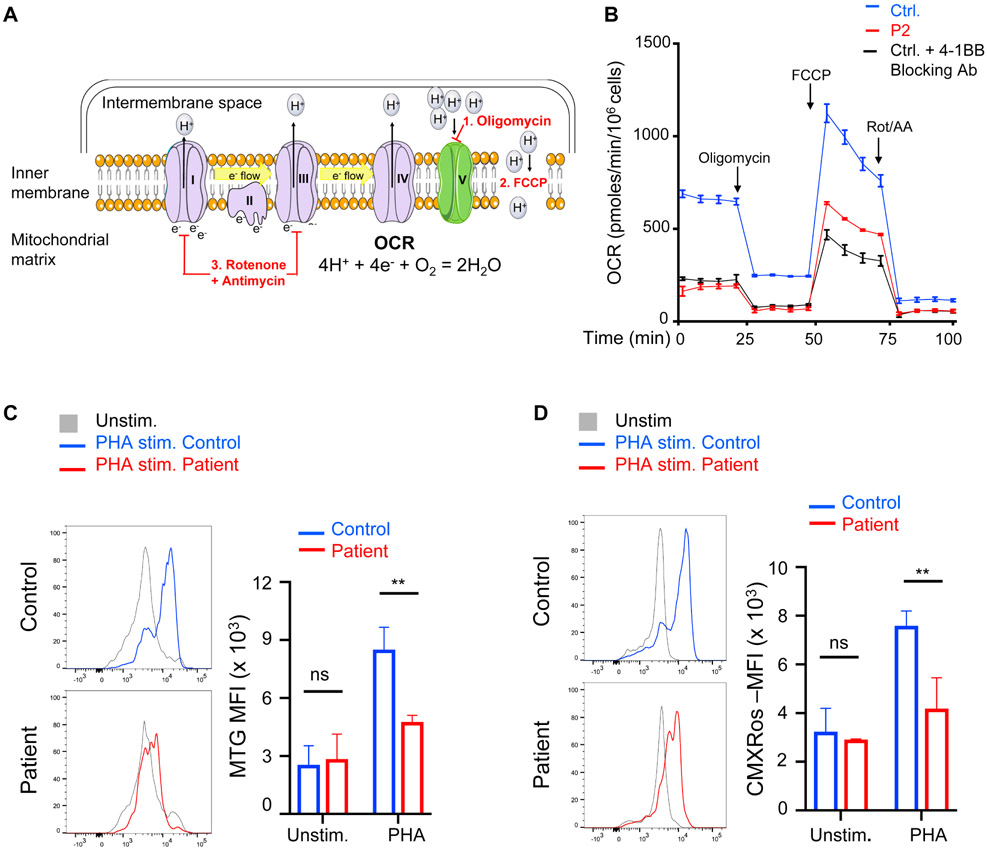
Figure 4. Defective mitochondrial biogenesis and function in the patients’ activated CD8+ T cells.
A. Schematic of factors determining the oxygen consumption rate (OCR). Complexes I – IV comprise the electron transport chain. The stepwise addition of reagents used during the extracellular flux analysis (1 – 3) are depicted in red. B. Extracellular flux analysis of T cells purified from PHA-stimulated PBMCs for 3 days from P2 (data pooled from two independent experiments) and controls without or with 4-1BB blocking antibody BBK-2 (n=2). C, D. Representative FACS analysis (left) and quantitative analysis (MFI, right) of mitochondrial mass measured using MitoTracker Green (MTG) (C) and of mitochondrial membrane potential measured using MitoTracker Red CMXRos (D) of CD8+ cells in PHA stimulated cultures of PBMCs from patients (n=2) and controls (n=3). Columns and bars represent mean + SEM. ** p<0.01, ns= not significant.

