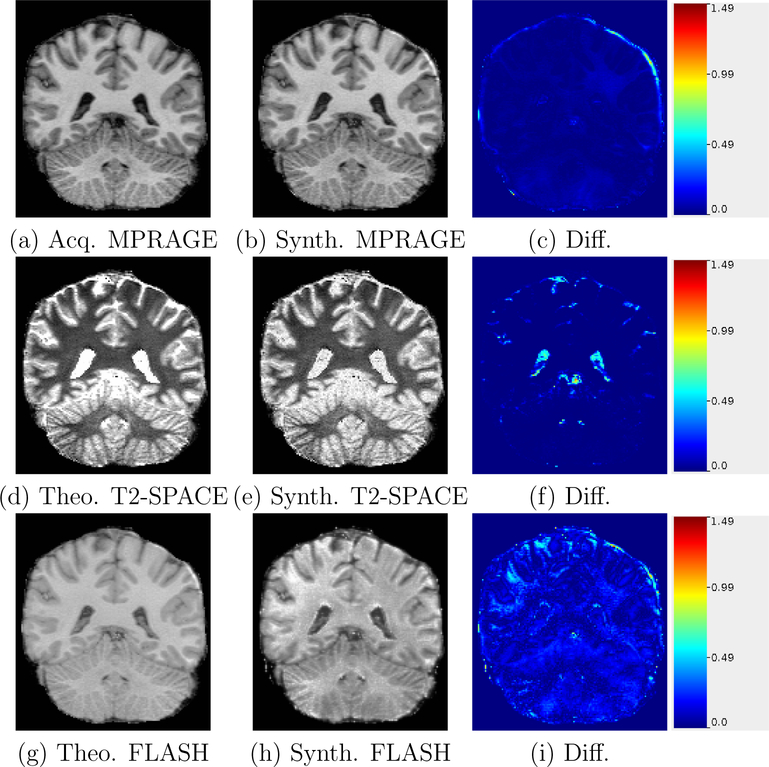
Figure 2:
Acquired/theoretical equation generated images compared with approximate synthesis images used in PSACNN training. The difference images are shown in the right column. The color scale shows the absolute intensity difference ranges from 0 to 1.5, where the maximum intensity in the image is 1.5.

