Figure 6.

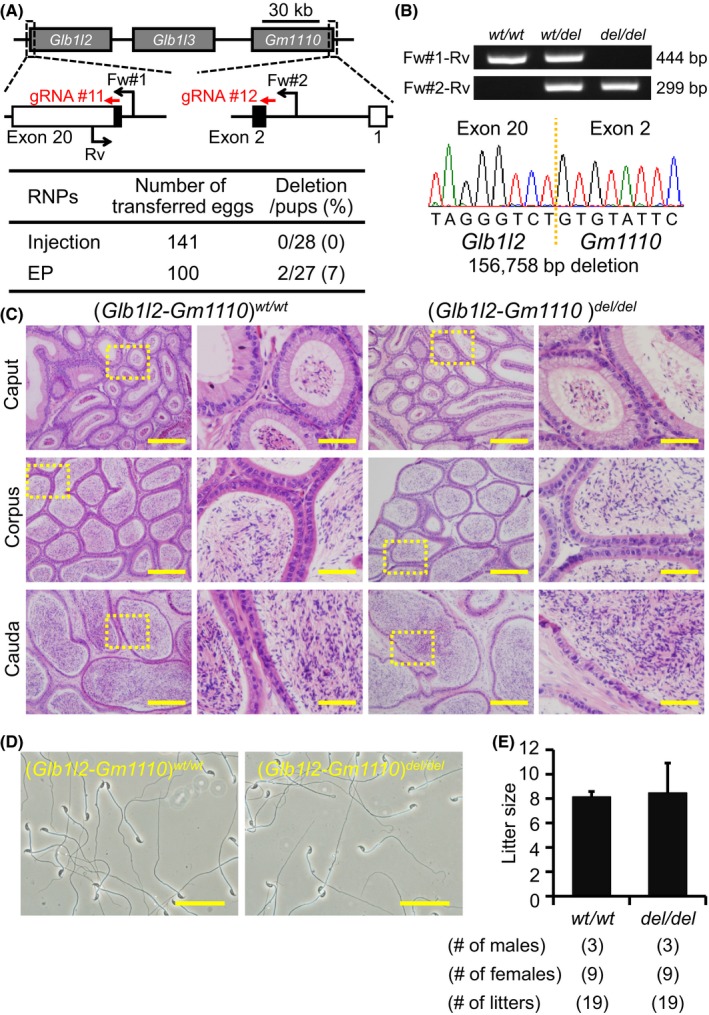
Fecundity of Glb1l2‐Gm1110 KO mice. (A) Genome editing efficiency with gRNA/Cas9 RNPs. Black arrows: primers for genotyping, Black boxes: coding region. (B) Genotyping with PCR and DNA sequencing. Three primers (Fw#1, Fw#2, and Rv) were used for the PCR (also see panel A). em1: 156,758 bp deletion. (C) Histological analysis with H&E staining. Dashed areas in left panels were enlarged (right panels). Scale bars on the left and right panels are 200 μm and 50 μm, respectively. (D) Sperm morphology observed under phase contrast. Scale bars: 50 μm. (E) Male fecundity. There was no difference in average litter size between WT and KO males (p = 0.83). [Colour figure can be viewed at wileyonlinelibrary.com]
