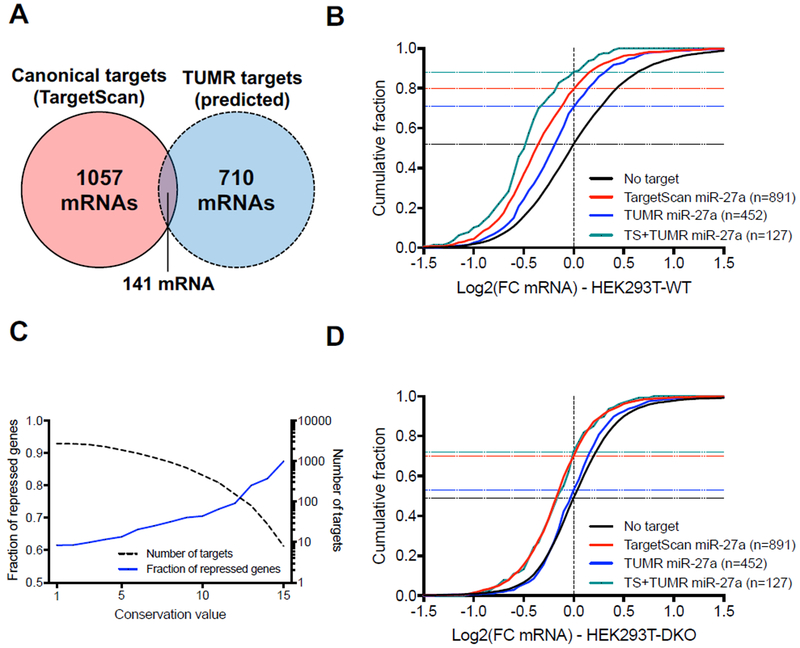
Figure 6. Uridylated miR-27a isomiRs repress a subset of endogenous mRNAs.
(A) Venn diagram of the canonical targets of miR-27a predicted by TargetScan (8mer, 7mer-A1, 7mer-m8) and the conserved TUMR targets. (B) Cumulative curve comparing the effect of miR-27a canonical target sites (Adj. p-value<0.0001 vs. No target) and conserved TUMR targets (adj. p-value<0.0001 vs. No target) in HEK293T wild-type cells. The number of genes analyzed in each group is in parentheses, while horizontal dash lines indicate the fraction of repressed genes (Log2(FC)<0) in each group. (C) Plot presenting the fraction of repressed genes (Log2(FC)<0) (solid blue line, left axis) and the number of genes (dashed black line, right axis) as a function of the conservation score on the x-axis. Conservation score was defined as the number of organisms among which the pairing between the target site and the miR-27a 3’ region is conserved. (D) Cumulative curve comparing the effects on miR-27a canonical target sites (Adj. p-value<0.0001 vs. No target) and conserved TUMR targets in HEK293T TUT4/7 DKO Cells. Parentheses, the number of genes analyzed in each group. The horizontal dash lines indicate the fraction of repressed genes (Log2(FC)<0) in each group. Adjusted p-values were calculated using one-way ANOVA with multiple comparisons. See also Figure S5.

