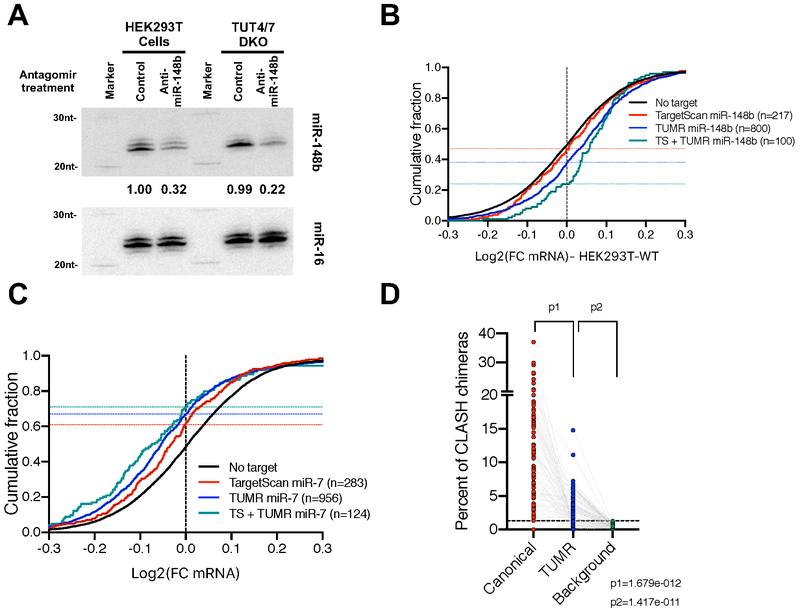
Figure 7. TUMR expands the target range of endogenous miRNAs.
(A) Antagomirs (20 nM final concentration) of either anti-miR-148b or a control sequence were transfected into HEK293T cells or TUT4/7 DKO cells to block miR-148b function. Small RNAs were extracted and subject to Northern blotting. Endogenous miR-148b was detected by probe-miR-148b-3p. Endogenous miR-16 was detected by probe-miR-16-5p and served as loading controls. In each lane, the level of miR-148b was normalized to that of miR-16 and reported relative to control treatment in WT cells. (B) Cumulative curve comparing the effect of miR-148b reduction on mRNAs containing TargetScan sites (Adj. p-value<0.05 vs. No target), TUMR target sites (Adj. p-value<0.0001 vs. No target) and both sites (Adj. P-value<0.0001) in HEK293T wild-type cells. (C) Cumulative curve comparing the effect of miR-7 induction on mRNAs harboring TargetScan target sites (Adj. p-value<0.0001 vs. No target), TUMR target sites (adj. p-value<0.0001 vs. No target) and both sites (Adj. P-value<0.0001) in mouse brain (Kleaveland et al., 2018). (D) Analysis of miRNA target sequences identified by CLASH (Helwak et al., 2013). 79 miRNAs with more than 50 unique chimeric reads were analyzed. For each miRNA, percentages of canonical targets and TUMR targets relative to all chimeric reads of the queried miRNA were plotted. For each miRNA, the background was calculated as the chance its TUMR target sites identified in all unrelated chimeric reads. See also Figure S6.

