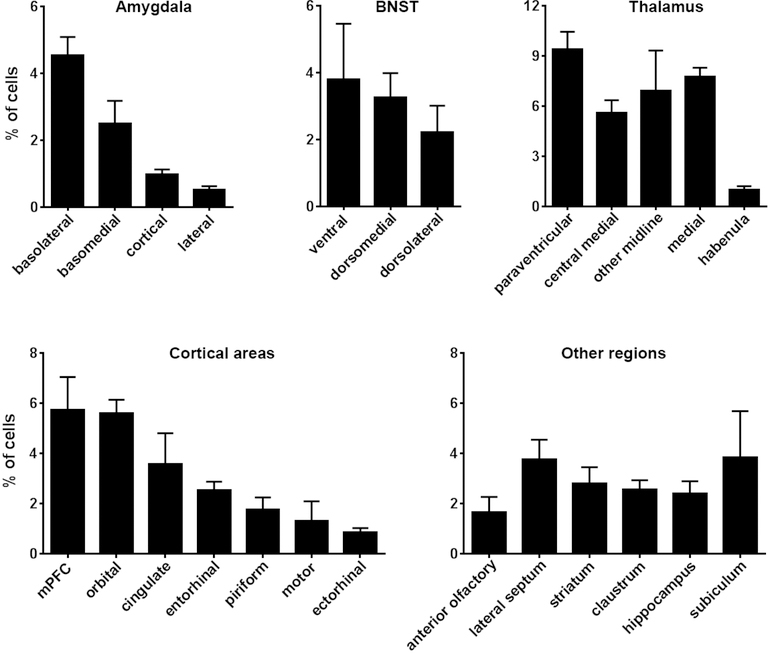
Figure 3. Quantification of CRH-expressing cells projecting to the nucleus accumbens.
The graphs show the average contribution, depicted as %, of CRH+ cells in several key brain regions that provide inputs to the NAc. The relative contribution is defined as the percentage of the number of labeled neurons in a specified structure versus all quantified CRH+ afferent cells. Data are presented as mean ± SEM. Five mice were quantified with NAc viral injection. A total of 8,766 cells were counted manually from 206 sections (33–65 sections and 1,278–2,389 cells per mouse, an average of 1753.2 cells ± 221.6 SEM per mouse). Consistent with illustrations in Figure 2, the majority of CRH+NAC-targeting origin cells resided in the amygdala, BNST, thalamus (mainly PVT) and cortex (mainly mPFC). Please see Figure 2 for abbreviations.

