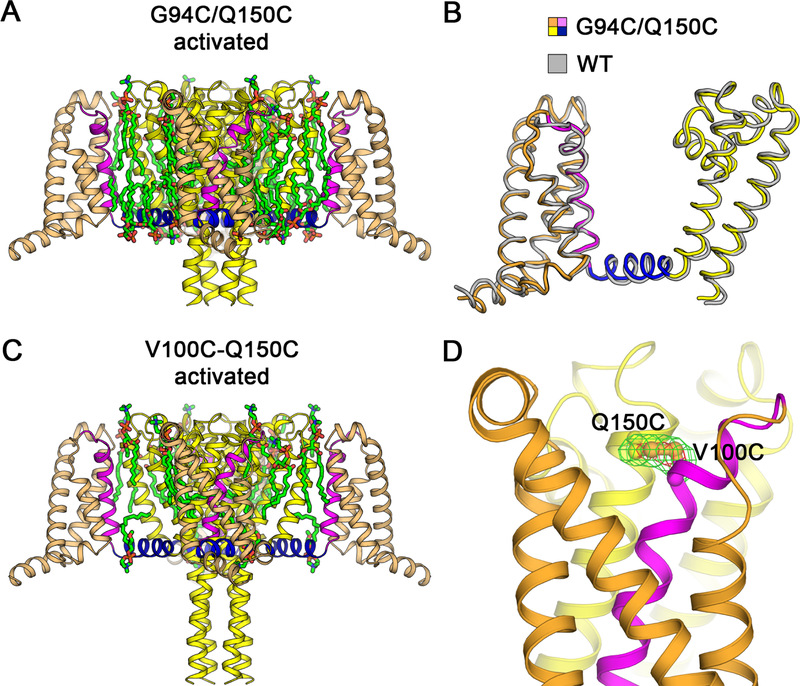
Figure 3. Structures of NaVAb G94C/Q150C and Disulfide-crosslinked NaVAb V100C/Q150C in the Activated State.
(A) Overall structure of NaVAb/G94C/Q150C Δ28 activated state. The VS S0 to S3 segments are colored in orange and S4 in magenta. The S4-S5 linker is shown in blue and the pore module S5 to S6 in yellow. Ordered DMPC phospholipid molecules are highlighted in green for acyl chains and orange/red for phosphate head groups.
(B) Superposition of NaVAb/G94C/Q150C Δ28 structure with NaVAb/WT structure (PDB 4EKW). Cα backbone structures are shown with NaVAb/WT colored in gray with Cα r.m.s.d. of ~0.9 Å.
(C) Overall structure of NaVAb/V100C/Q150C Δ28 disulfide-crosslinked activated state. The structure is rendered as in (A). Difference in the C-terminal tail is due to crystallization pH condition (pH 4.8 vs. pH 5.6–6.0 for NaVAb/G94C/Q150C Δ28).
(D) Electron density map for V100C-Q150C disulfide bond. The FO−FC difference map is shown for V100C and Q150C side chains at 3.5σ (green) and 7σ (red) contour levels. Sulfur atoms on cysteine side chains are shown in gold.

