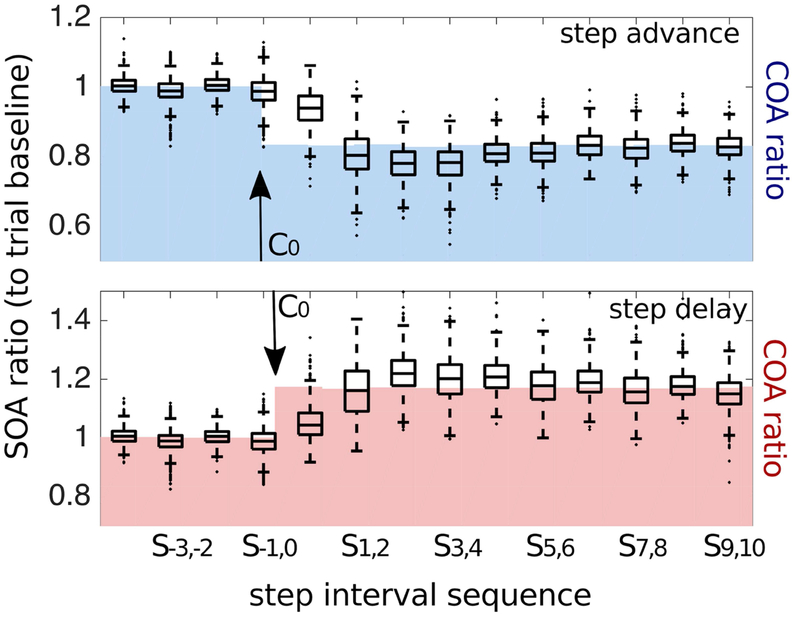
Figure 2. Behavioral results.
Boxplots show the distributions of single-trial step onset asynchronies (SOAs) across participants (in each box, the central black horizontal bar indicates the median, and the bottom and top edges of the box indicate the 25th and 75th percentiles, respectively. The vertical whiskers extend to the most extreme data points not considered outliers; outliers are plotted individually using black dots) in the two perturbation conditions (step-advance, upper panel; step-delay, lower panel), background blue- and red-shaded areas show the pacing cue onset asynchronies (COAs). SOA values are expressed as ratio change from trial pre-shift baseline SOA. Offsets of COA shifts (vertical arrows) symbolize that in step delay, cue C0 follows S0 while in step advance, cue C0 on average slightly precedes S0.

