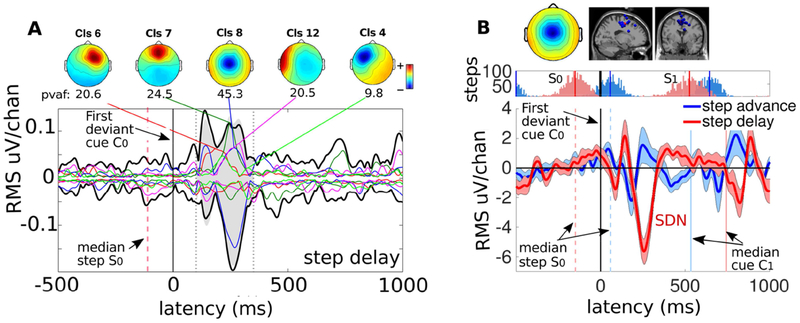
Figure 3. Source cluster contributions to ERPs time locked to the first latency-perturbed cue presentation in step-delay trials and average pMFC cluster ERPs.
A. (colored traces) ERP envelopes for the 5 largest-contributing in the 100-350 ms time range (shaded, between the dotted lines) source clusters (cluster-mean scalp maps shown) versus the ‘sum of all 9 clusters’ ERP envelope (black traces) for step delay trials. B. pMFC cluster-mean scalp map and equivalent dipole locations, step latency trial histograms, and cluster-mean IC ERPs for step-delay (red line) and step-advance (blue line) shifts. Step-delay perturbations (only) show a prominent negative deflection peaking 250+ ms after C0 onset, here referred to as the step-delay negativity (SDN), while step-advance perturbation include a much smaller and slightly earlier negative deflection. Tinted ERP envelopes indicate confidence intervals (±3 standard errors). The black vertical line at zero marks the onset of the first deviant cue tone (C0); dashed vertical lines represent the median latencies of the nearest heel strike (red: step-delay, blue: step-advance; note heel strike histograms above); ensuing solid vertical lines represent median times of occurrence of the next cue tone onset. IC activities are scaled by RMS of the column corresponding to the IC of the inverse ICA weight matrix (the IC scalp map).

