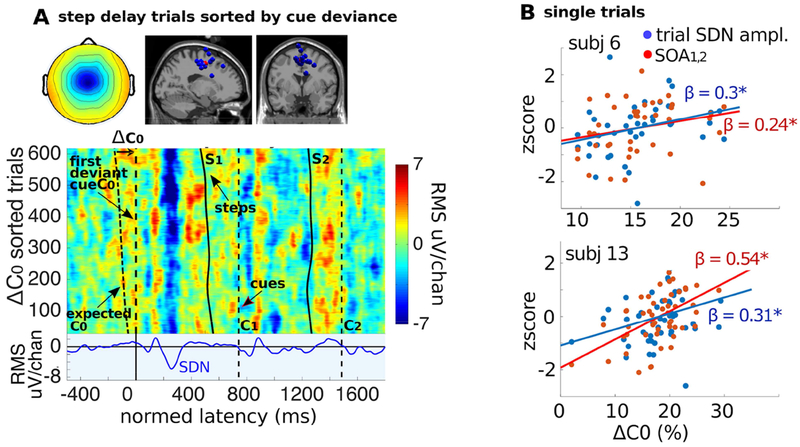
Figure 5. Single-trial step-delay responses to C0 and regressions on ΔC0.
A. Top row: Cluster-mean scalp map and cluster-IC equivalent dipole locations. Below: After normalization by time warping (as in Fig. 4), the single-trial ERPs were pooled across all ICs in the pMFC cluster and sorted by the normalized difference (ΔC0) between C0 and expected C0 latencies to make an ERP-image plot (vertical smoothing, 30 trials). Cool colors (blue) indicate negative activation values, warm colors (yellow to red) positive activation values. Dashed black vertical lines represent cue tones (C0 to C2). The leftmost dashed black trace represents the latency at which cue C0 was expected to occur. Solid black traces represent heel strike latencies for steps S1 and S2. In upper trials with relatively large ΔC0 the negative (SDN) deflection near 250 ms is stronger. The bottom panel shows the cluster-mean ERP. B. The effects of ΔC0 on SDN magnitude and on SOA1,2 adaptation-step size. Scatterplots for two of the 15 pMFC cluster ICs (subject 6 - 41 trials and subject 13 - 54 trials) showing relationships between ΔC0 (on the x-axis), and z-scored SDN magnitude (blue dots) as well as z-scored adaptation-step size SOA1,2 (red dots). Asterisks indicate significance (p<0.05).

