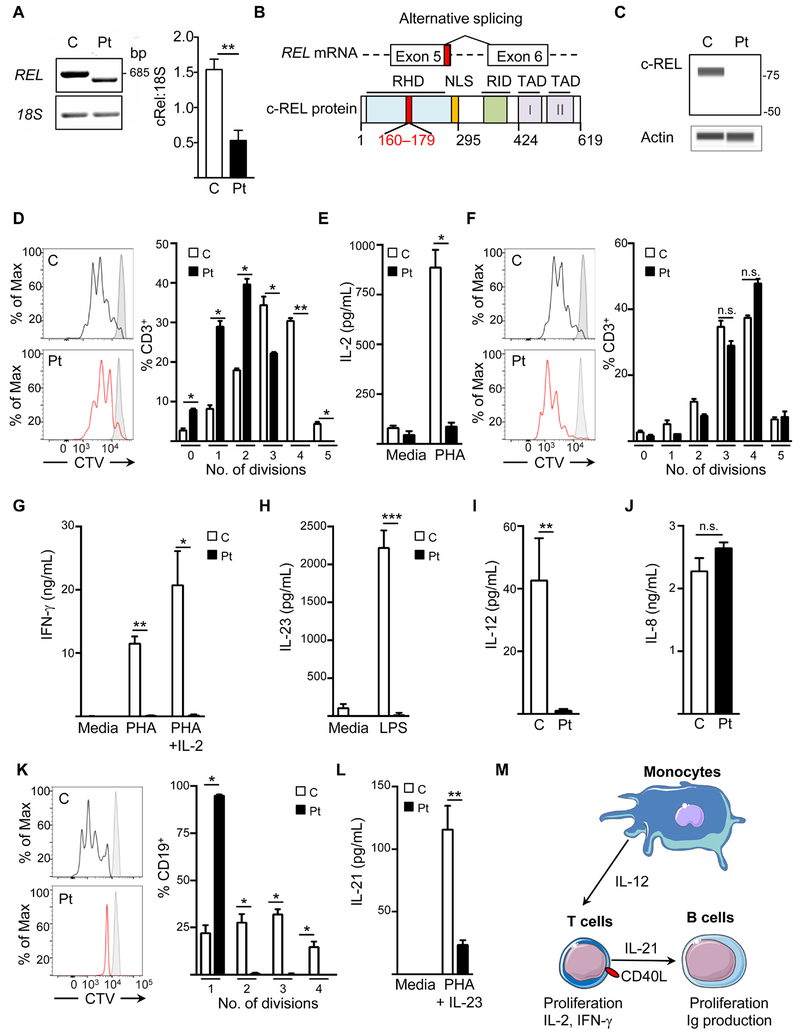
Figure 1.
A. Representative electrophoresis (left) and densitometry quantification of REL cDNA from EBV-transformed lymphoblastoid cell lines (EBV-LCLs) from controls and the patient. B. Schematic of REL cDNA and protein with the patient’s deleted nucleotides and residues in red. C. Representative immunoblot of c-Rel in lysates of peripheral blood mononuclear cells (PBMCs) from the patient and controls. D. CD3+ T cell proliferation to phytohemagglutinin (PHA), measured by CellTrace Violet (CTV) dilution. E. IL-2 secretion from patient and control PBMCs, with or without PHA stimulation. F. CD3+ T cell proliferation to PHA+IL-2. G, H. Secretion of IFN-γ (G) and IL-23 (H) by PBMCs from the patient and controls cultured with the indicated stimuli. I, J. Secretion of IL-12 (I) and IL-8 (J) by EBV-LCLs from the patient and controls stimulated with PDBu. K. CD19+ B cell proliferation to anti-CD40+IL-21. L. IL-21 secretion by PHA blasts from the patient or controls with or without PHA+IL-23 stimulation. M. Schematic of the contribution of c-Rel to adaptive and innate immunity. *p<0.05, **p<0.01. Data in A, E, G – J, and L are pooled from two independent experiments; data in C, D, F, K are representative of two to three independent experiments.

