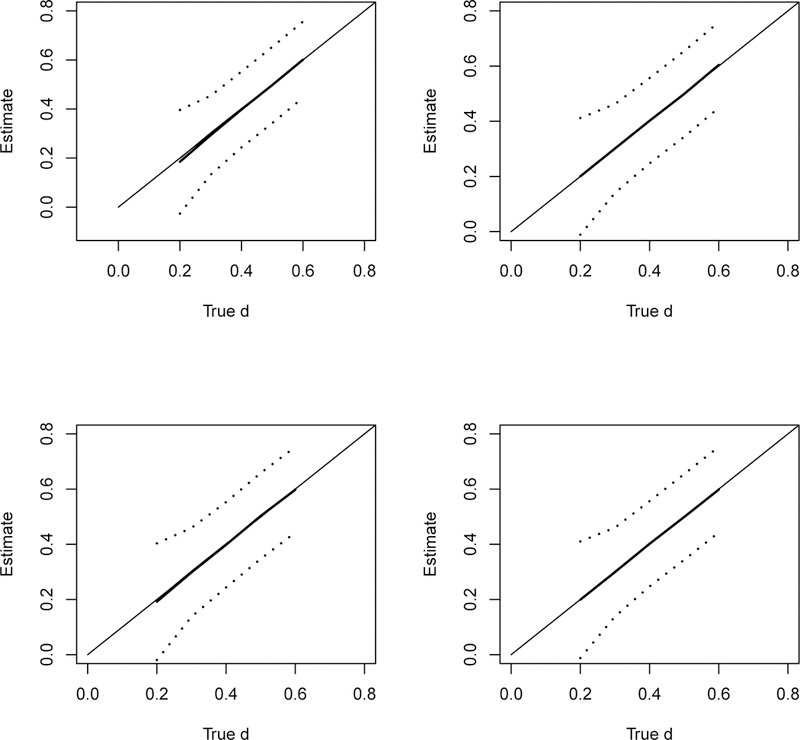
FIGURE 3.

Top: Estimate of d versus true d from a sample of 6 p-values, left: 1/3 each with sample size of (30, 50, 80) and right: 1/3 each with sample size of (100, 150, 200) in both arms of the study; Bottom: same as top 2 panels except that the estimates were based on a sample of 12 p-values. The solid line is the MLE and the dotted lines are point-wise 95% confidence bound. We also report the weighted sample mean of the study-specific SMD estimates. The inverse of the squared standard error of the estimates was used as the weight. These weighted means were almost identical to our estimates and the two plots are not distinguishable.
