
FIGURE 4.
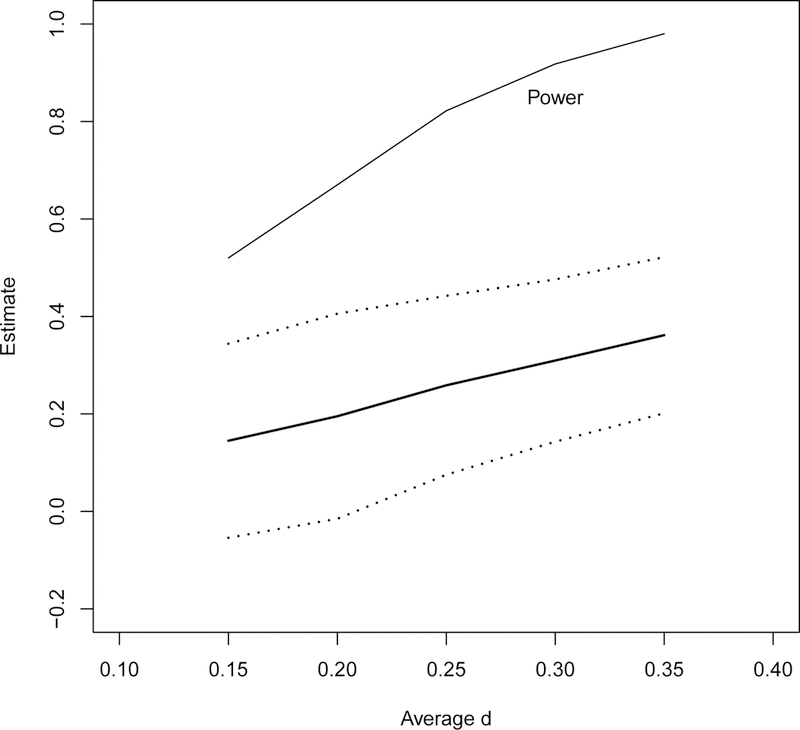
Estimate of d versus average d from a sample of 6 p-values with heterogeneous sequentially-spreaded effect size, 1/3 each with sample size of (30, 50, 80). The effect sizes for the 6 studies are 0.125, 0.135, 0.145, 0.155, 0.165, and 0.175 with mean 0.15, and 0.175 to 0.225 with mean 0.20, 0.225 to 0.275 with mean 0.25, 0.275 to 0.325 with mean 0.30, and 0.325 to 0.375 with mean 0.35. The solid line is the MLE and the dotted lines are point-wise 95% confidence bound. The top line is the empirical power of the Wald test against H0 : d = 0.