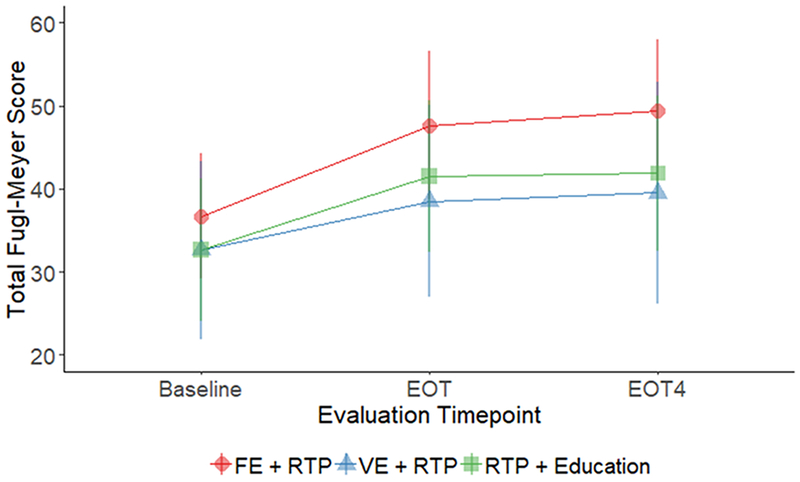
Figure 2:

Line plot depicting mean and standard deviations of Fugl-Meyer Scores at baseline, end of treatment (EOT) and four weeks following end of treatment (EOT+4). A significant interaction effect was found indicating that improvements were greatest for the FE+RTP group (p=0.001).
