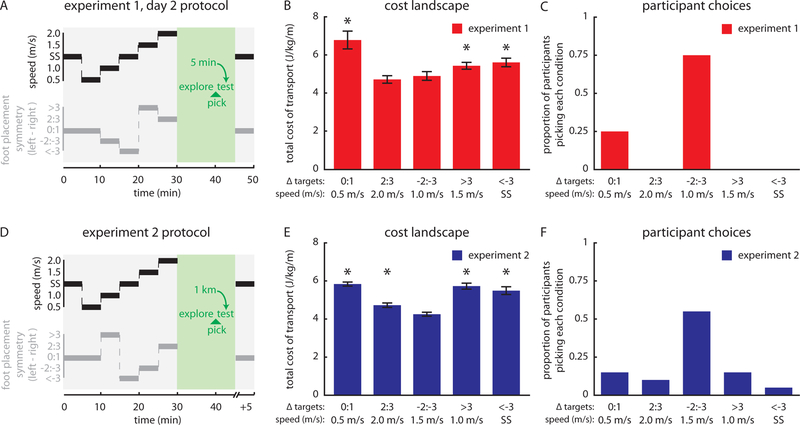
Figure 3.
A) Day 2 protocol for Experiment 1. Line color conventions are consistent with Figure 1. Green text indicates that the controller was active. Gray shading indicates that the treadmill speed was set by the experimenter; green shading indicates that the speed was set by the controller. B) Costs of transport for asymmetry/speed combinations prescribed by the Experiment 1 controller (mean±SEM). *indicates difference compared to least costly condition with p<0.05. C) Proportion of participants picking each combination during the Experiment 1 test period. D) Protocol for Experiment 2. E) Costs of transport for asymmetry/speed combination prescribed by the Experiment 2 controller (mean±SEM). *indicates difference compared to least costly condition with p<0.05. F) Proportion of participants picking each combination during the Experiment 2 test period.

