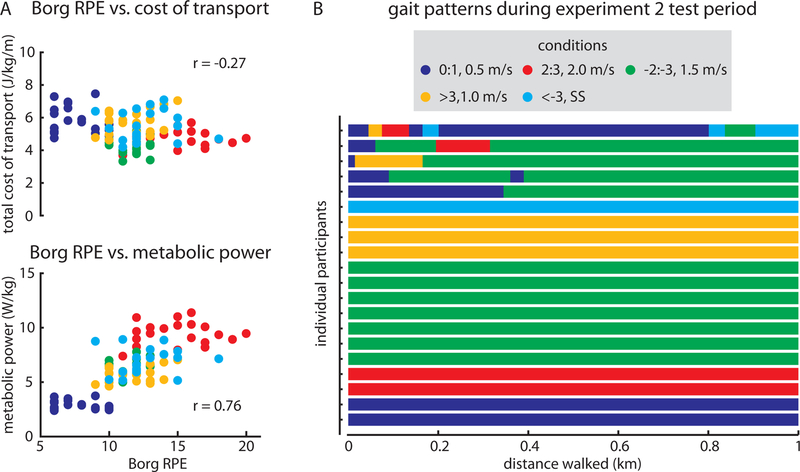
Figure 4.
A) Relationships between Borg Rating of Perceived Exertion (RPE) and total cost of transport (top) and metabolic power (bottom) for each asymmetry/speed combination in Experiment 2. Cost of transport showed a weak negative association with Borg RPE while metabolic power showed a strong positive association with Borg RPE (both p<0.05). B) Asymmetry/speed combinations used by each participant during the Experiment 2 test period along the kilometer walked.

