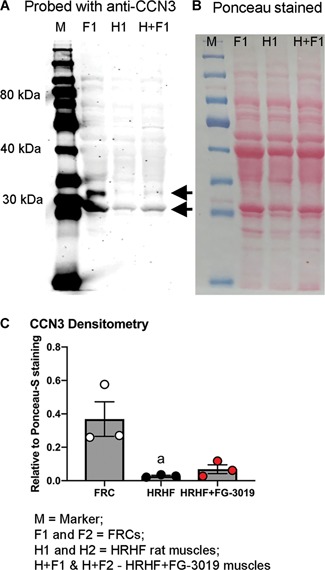
Figure 5.

Anti‐CCN3/NOV probed Western blots showing truncated forms of CCN3 with approximate molecular weights of 32 and 28 kDa (arrows). (A) Western blot showing flexor digitorum muscle samples from food‐restricted control rats (F; FRC), untreated high repetition high force rats (H; HRHF), and HRHF rats treated with the FG‐3019 agent (H + F; HRHF + FG‐3019). (B) Ponceau‐S red staining of same membrane shown in panel A. (C) Densitometry results in which CCN3 bands were compared with the total protein loaded per lane, determined from Ponceau‐S red stained membranes. Gels were repeated until three different samples per group were assayed. a: p < 0.05, compared with FRC levels [Color figure can be viewed at wileyonlinelibrary.com]
