Figure 7.

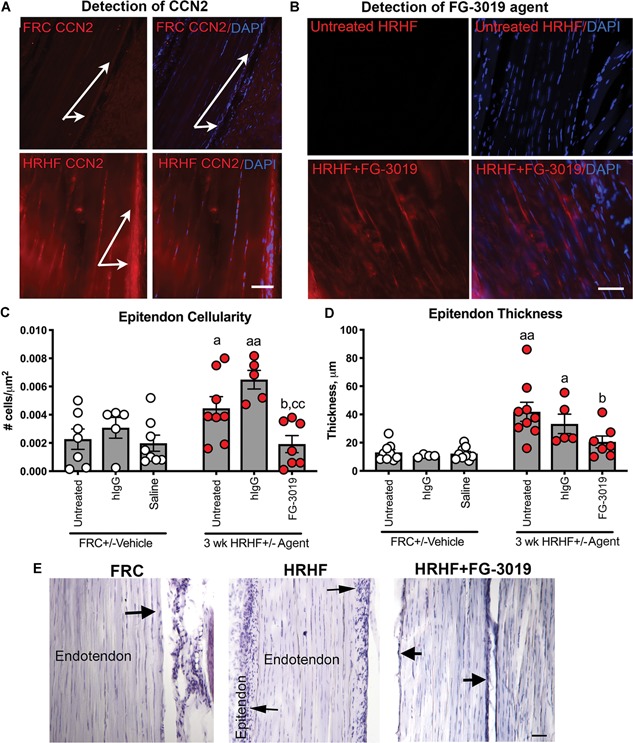
Task‐ and treatment‐induced changes in flexor digitorum tendons at wrist level. (A) Location of cellular communication network factor 2 (CCN2) staining in tendons showing increases in tenocytes and epitendon cells of high repetition high force (HRHF) rats (arrows). (B) Anti‐human immunoglobulin G (IgG) detection of FG‐3019 agent in tendons of HRHF + FG‐3019 rats; staining absent in untreated HRHF rats. (C) and (D) Quantification of epitendon cellularity and thickness. (E) Representative images of hematoxylin and eosin stained tendons. Arrows indicate epitendon region. a: p < 0.05 and aa: p < 0.01, compared with matched food‐restricted control (FRC) group; b: p < 0.05, compared with untreated HRHF rats; cc: p < 0.01, compared with HRHF + hIgG rats. Scale bars = 50 μm [Color figure can be viewed at wileyonlinelibrary.com]
