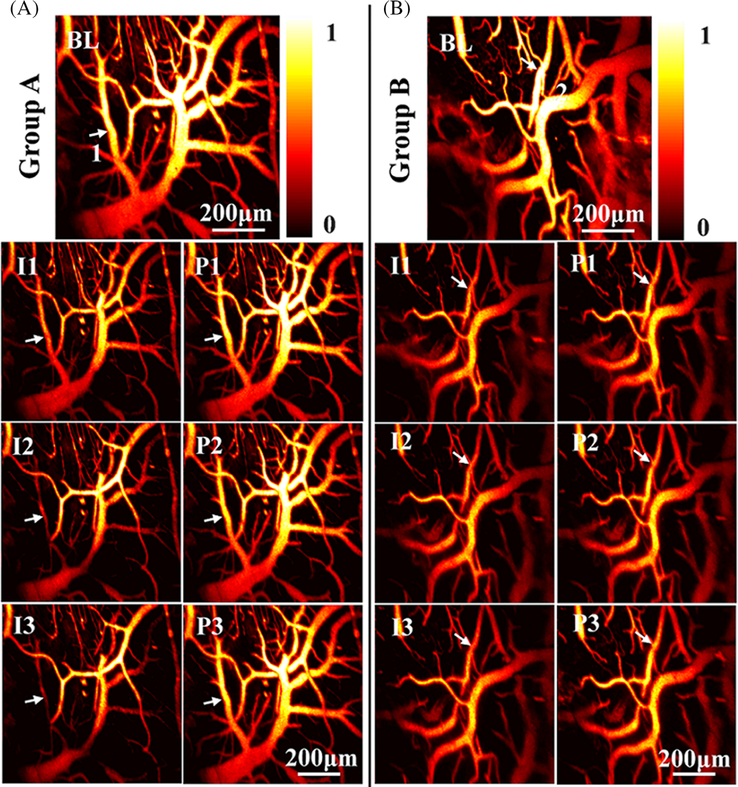
FIGURE 3.
Photoacoustic visualization of cerebral hemodynamics during ischemia and reperfusion. A, The first row shows the MAP image of a typical rat brain before bilateral carotid ligation in the first group. I1 and P1 present the MAP images post the first 10-minute ligation and reperfusion. I2 and P2 present the MAP images post the second 10-minute ligation and reperfusion. I3 and P3 present the MAP images post the third ligation and reperfusion. B, Representative MAP images of the second group with a different ligation/reperfusion time of 20 minutes

