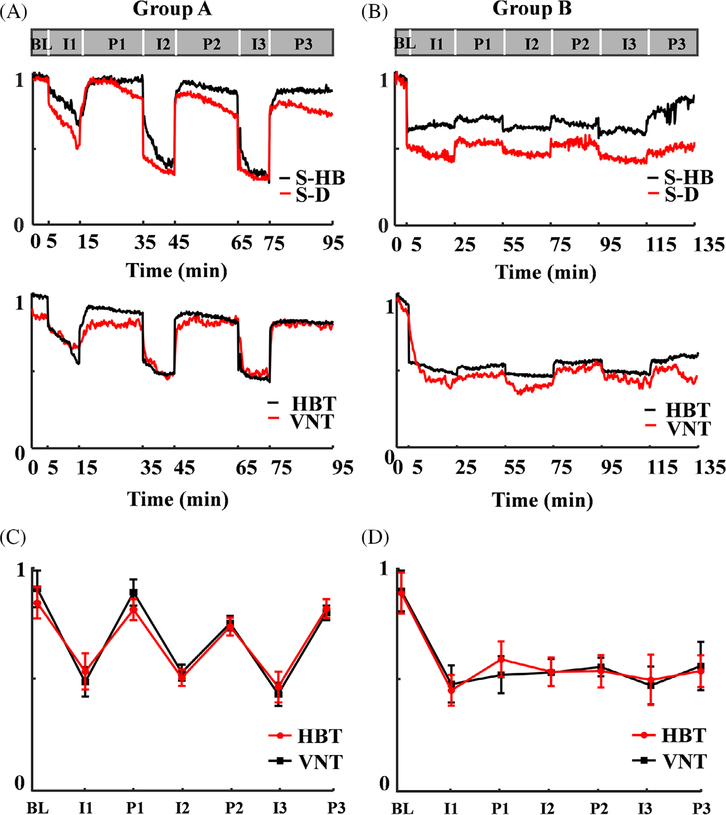
FIGURE 4.
Quantitative analysis of total hemoglobin inside selected vessels, diameters of selected vessels, total hemoglobin in the image domain and total vascular numbers over the entire FOV in Group A (A) and Group B (B). The statistical analysis of total hemoglobin and total vascular numbers in each stage in group A (C) and group B (D). S-HB, total hemoglobin in selected vessels; S-D, diameters of selected vessels; HBT: total hemoglobin; VNT, total vascular number. BL: Baseline, I1: the first time to ligation, P1: the first tome to perfusion, I2: the second time to ligation, P2: the second time to perfusion; I3: the third time to ligation, P3: the third time to perfusion, error bar means the mean ± SD

