
Figure 1.
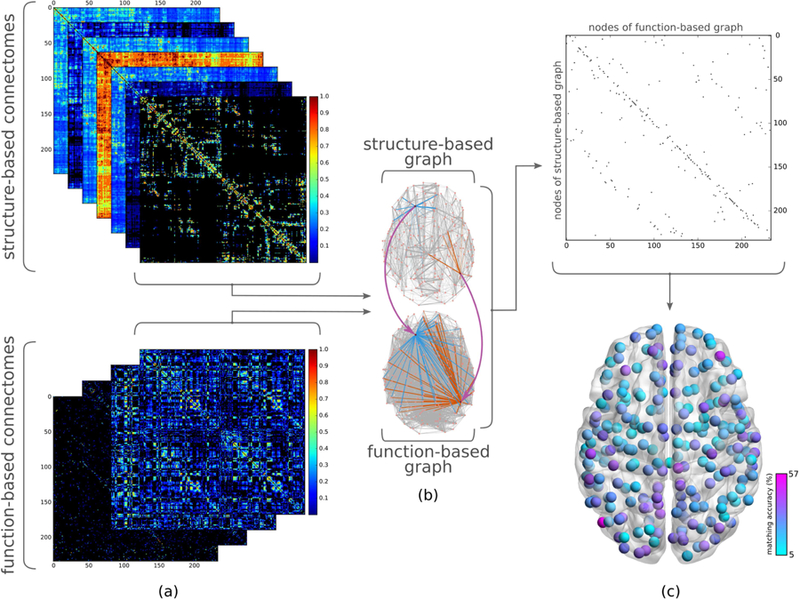
Overview of study of structure-function relationship using graph matching. (a) (top) Separate connectomes corresponding to various traffic patterns are derived from the weighted structural connectome (i.e., direct connections, unweighted and weighted shortest path, search information, path transitivity, unweighted and weighted communicability). (bottom) Positive and negative functional connectivities for full and partial correlation-based functional connectomes are considered separately in order to investigate structural underpinnings of positive and negative functional connectivity independently. (b) Taking one structure and one function derived connectome, the similarity between their graph representations is calculated using graph matching, yielding a binary matching matrix (c) (top) which contains ones to indicate nodes of a structure-based graph (rows) mapped to those of a function-based graph (columns) with the most similar connectivity patterns, and zeros elsewhere. (Note the difference between a matching matrix and a connectome: a cell of the matching matrix corresponds to a node of structure-based graph matching to a node of function-based graph, whereas a cell in the connectome indicates two regions of the brain being structurally or functionally connected.) (c) (bottom) Averaging the resulting binary matching matrices for all subjects, we obtain the likelihood of accurately matching each structural region with its functional counterpart.