
Figure 1. Illustration of the Social Approach Task and two different analytical approaches.
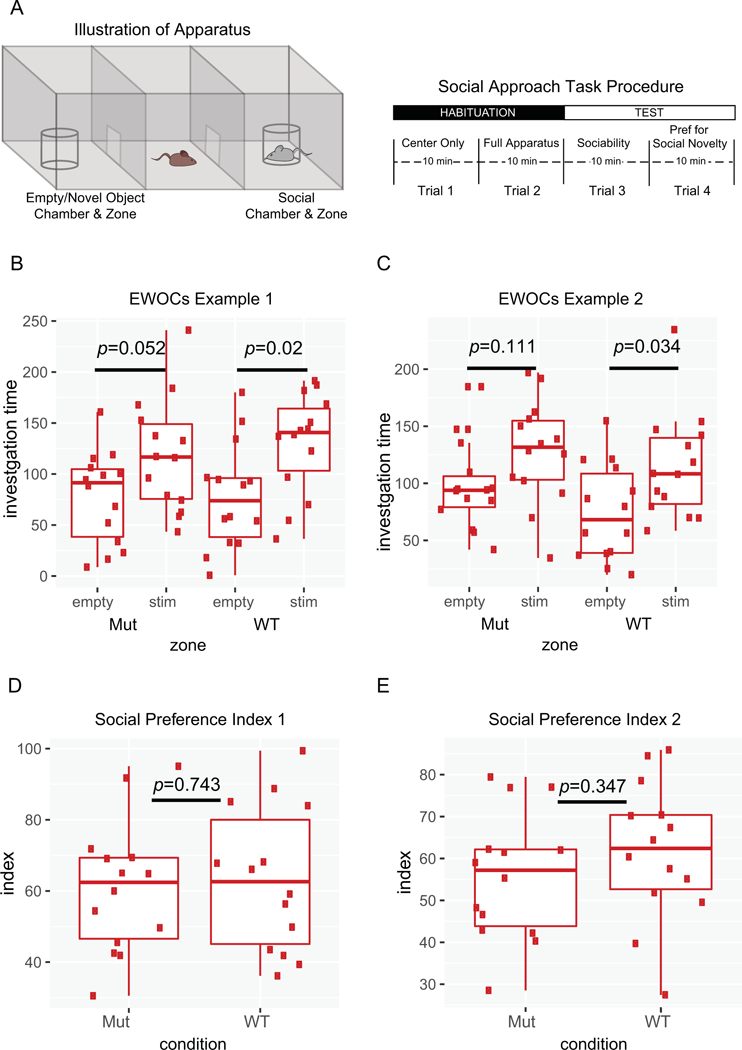
A) Schematic of Social Approach Task apparatus and typical procedure. B,C) Example plots from simulated data using EWOCs. Two arbitrary groups (‘Mut’ and ‘WT’) were tested for a within-group difference between the time spent with the social stimulus (stim) compared to the empty cup (empty). Only the WT group showed significant preference (p<0.05), while the Mut mice did not (p=0.052, or p=0.111). D,E) Example of these same data plotted as a social preference index:. Direct statistical comparison of Mut to WT indices shows no significant difference (p=0.743, 0.347).