
Figure 2. Using EWOCs can result in substantially elevated false positive rates, especially at low sample sizes.
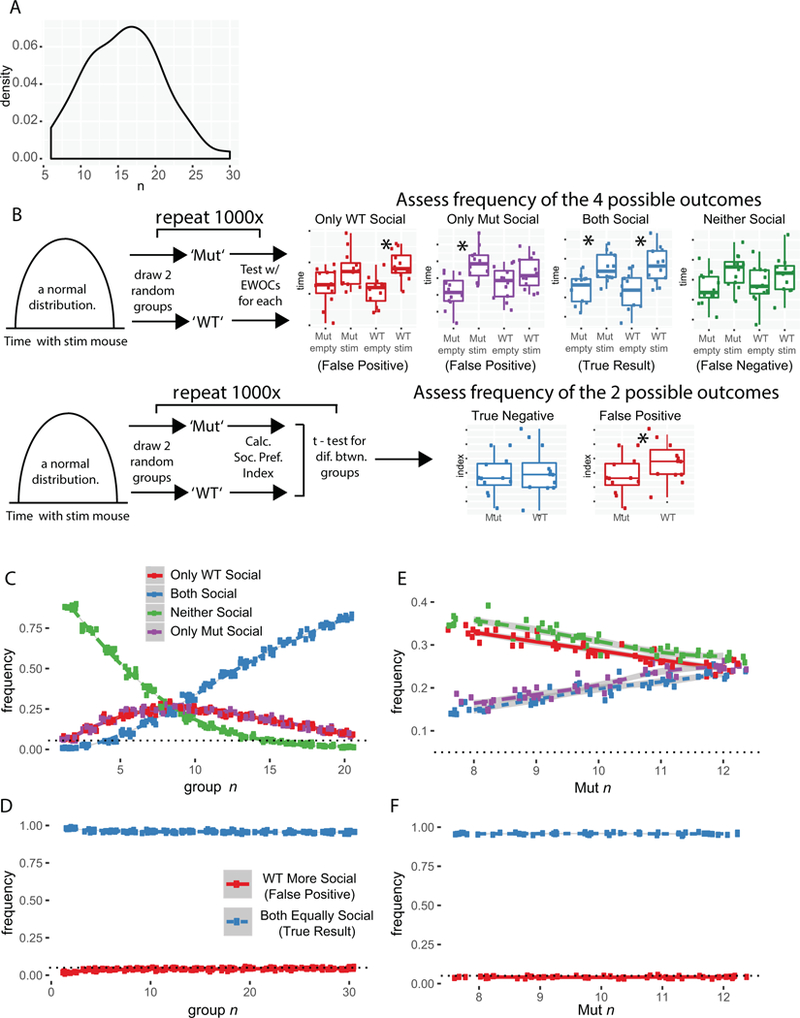
A) Distribution of group sizes (combined for genotype) across 77 groups in 29 papers. B) Cartoon of simulations and possible outcomes. Two groups (‘Mut’ and ‘WT’) are drawn from the same distribution with identical social preference magnitude, and then tested with EWOCs (upper panel) or a social preference index (lower panel). C) Plot of simulations results as function of n, after 10 × 1000 simulated experiments for each n, drawing two groups from the same distribution and analyzing with EWOCs. The true result is both groups are social (Blue), so incorrect conclusions were drawn a substantial proportion of the time. D) Plot of t-test on social preference index, showing false positive rate as a function of n. E) Simulation plot as a function of imbalanced n with WT n=12, and Mut n varied from 8 to 12, using EWOCs. F) Simulation plot as a function of imbalanced n, using t-test on the social preference index.