
Figure 3. Elevation of false positive rates depends on the magnitude of the social preference when EWOCs are used.
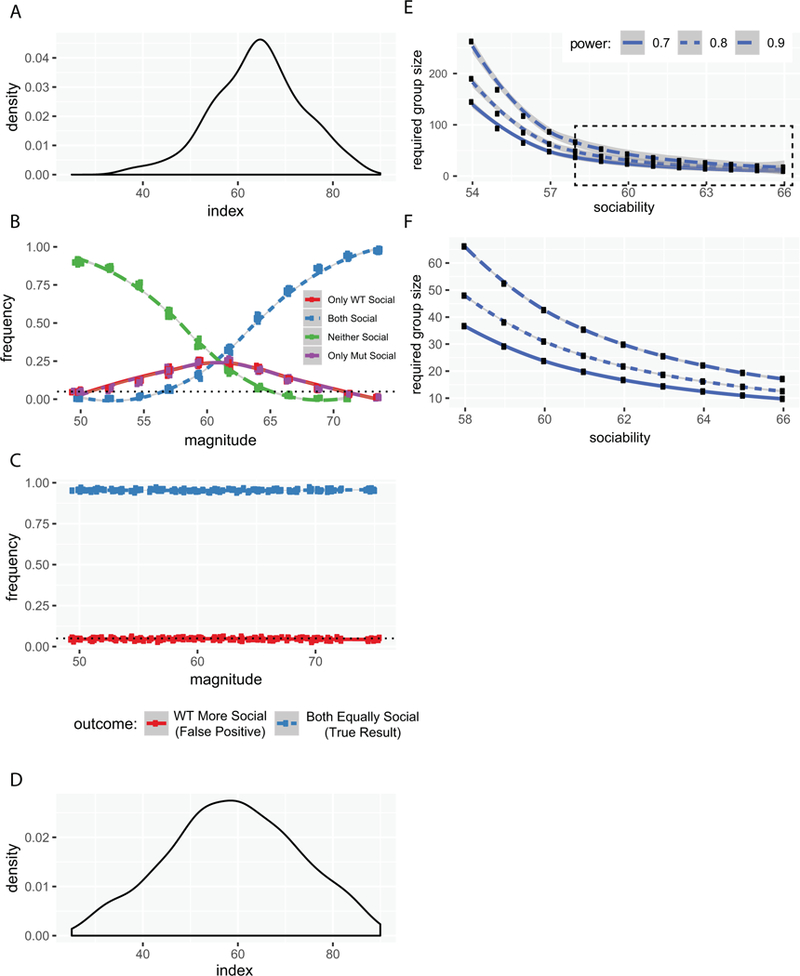
A) Distributions of average magnitudes of social preference indices across groups from the 29 reviewed studies. B) Plot of outcomes as a function of social preference magnitude when using EWOCs. C) Plot of false positive rate as a function of social preference magnitude when using t-test on social preference index. D) Distributions of magnitudes of social preference indices from all mice run in our lab (n=421). E) Power calculations showing required n per group as a function of the WT social preference index, to have 70%, 80%, or 90% power to detect a difference at 0.05. F) Same, replotting boxed region from E.