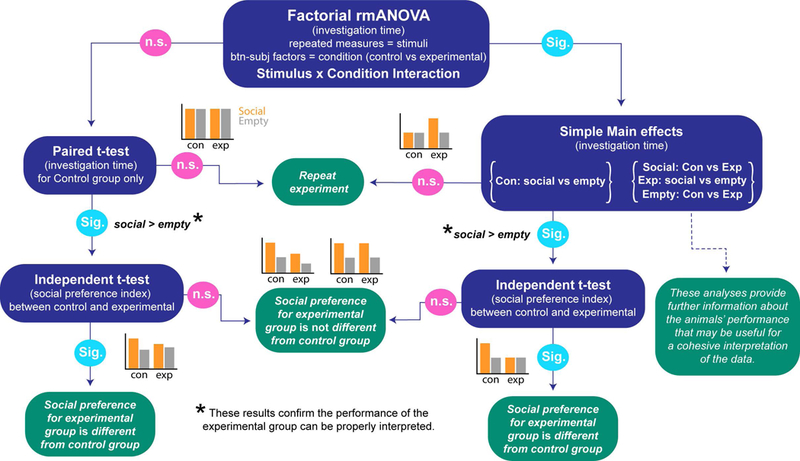
Figure 5. Social Approach Task data analysis decision tree.

A decision tree schematizing a statistical pathway for Social Approach Task data analysis, provided the data are normal and meet the other assumptions of univariate analysis. The blue bubbles present statistical tests with dependent variable of interest in parentheses. The green bubbles present interpretations of the test results. Sig. = significant; n.s. = non-significant. Example graphs provide representations of possible data for each outcome (con = control group, exp = experimental group).
