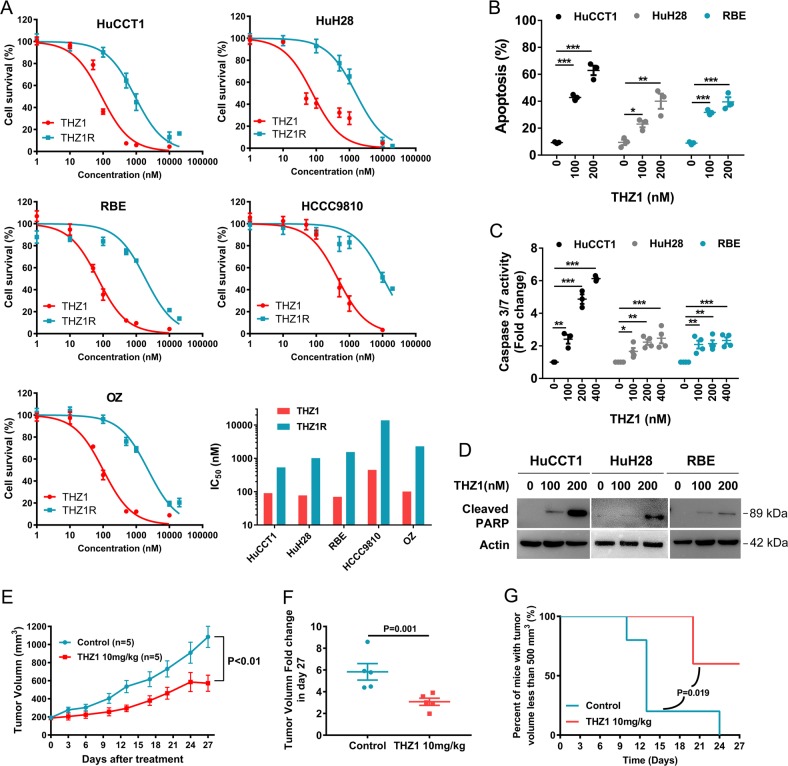
Fig. 3. THZ1 exhibits inhibitory potency against CCA in vitro and in vivo.
a Five CCA cell lines (HuCCT1, HuH28, RBE, HCCC9810, and OZ) were plated in 96-well plates and treated with THZ1 or THZ1R (a THZ1 analog with no significant inhibitory activity of CDK7) at different concentrations for 72 h. Cell viability was measured by CCK-8 assay and dose–response curves show percent cell viability to that of DMSO-treated cells. IC50 values were calculated using nonlinear regression analysis in Prism 7.0. Data represent mean ± SEM of three independent replicates. b HuCCT1, HuH28, and RBE cells were treated with THZ1 at two concentrations (100 nM and 200 nM) for 72 h and cell apoptosis was measured by Annexin V-FITC/PI staining followed by flow cytometry. Data represent mean ± SEM of three independent replicates. (*P < 0.05; **P < 0.01; ***P < 0.001) c HuCCT1, HuH28, and RBE cells were treated with three concentrations (100 nM, 200 nM, and 400 nM) of THZ1 for 48 h for measuring Caspase 3/7 activation. Data represent mean ± SEM of three independent replicates. (*P < 0.05; **P < 0.01; ***P < 0.001) d HuCCT1, HuH28, and RBE cells were treated with THZ1 for 24 h and Cleaved PARP was analyzed by western immunoblotting. β-actin served as an internal control. e Nude mice were injected subcutaneously with HuCCT1 cells and randomly separated into two groups when tumor size reached around 200 mm3. Two groups of mice were treated with THZ1 (10 mg/kg, bid, i.p.) or vehicle (bid, i.p.) for 27 days, separately. Tumor volume was measured twice a week. The growth curve was shown. f The fold change of tumor volume at day 27 relative to day 1 was shown as mean ± SEM. g The survival curves were assessed by percent of mice with tumor volume <500 mm3

