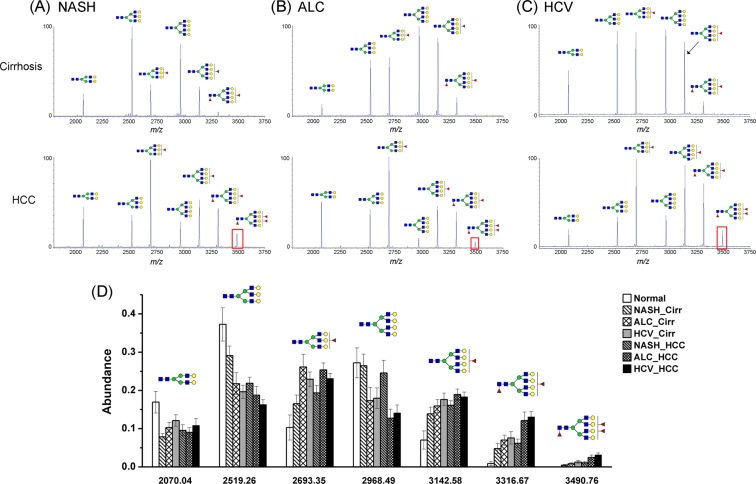
Figure 2.
(A–C) MALDI- TOF MS spectra showing the difference of glycosylation in N-glycans of AGP between HCC and cirrhosis in relation to the etiology, NASH (A), ALC (B), and HCV (C), respectively. The elevated presence of the trifucosylated tetra-antennary glycan in HCCs compared to cirrhosis of each etiology is highlighted with a red rectangle. (D) Relative abundance alteration of 7 main N-glycans in serum AGP derived from healthy controls and patients with cirrhosis and HCC of different etiologies, respectively.

