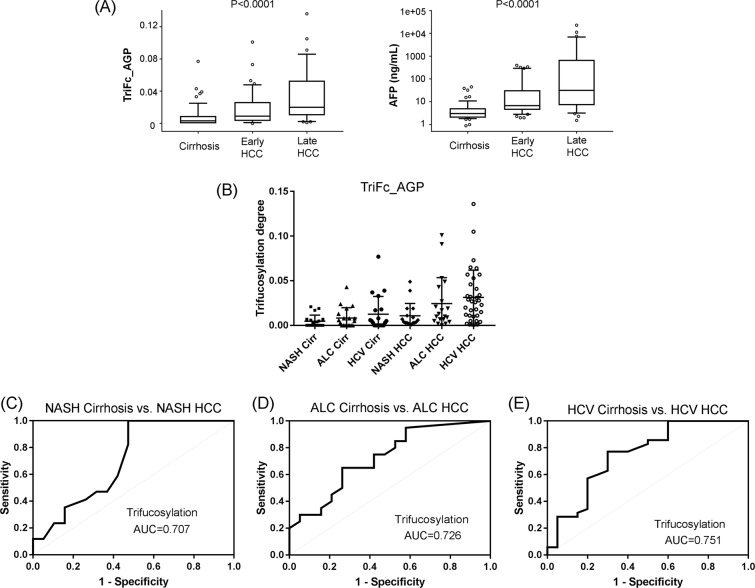
Figure 3.
(A) Box plots of the trifucosylation degrees of serum AGP and serum AFP levels among patients with cirrhosis, early-stage HCC, and late-stage HCC. The box refers to the 10th and 90th percentile values with a line indicating the median value. Points outside the interquartile range are outliers. The Kruskal-Wallis test showed a significant difference in the trifucosylation degree of AGP and serum AFP level during disease progression from cirrhosis to late HCC (P < 0.0001). (B) Scatter plot of the trifucosylation degree of AGP N-glycans in cirrhosis and HCC patients induced by NASH, ALC, and HCV, respectively. (C–E) Receiver operating characteristics (ROC) curves of the trifucosylation degree to differentiate HCC from cirrhosis cases induced by NASH (C), ALC (D), and HCV (E) respectively.

