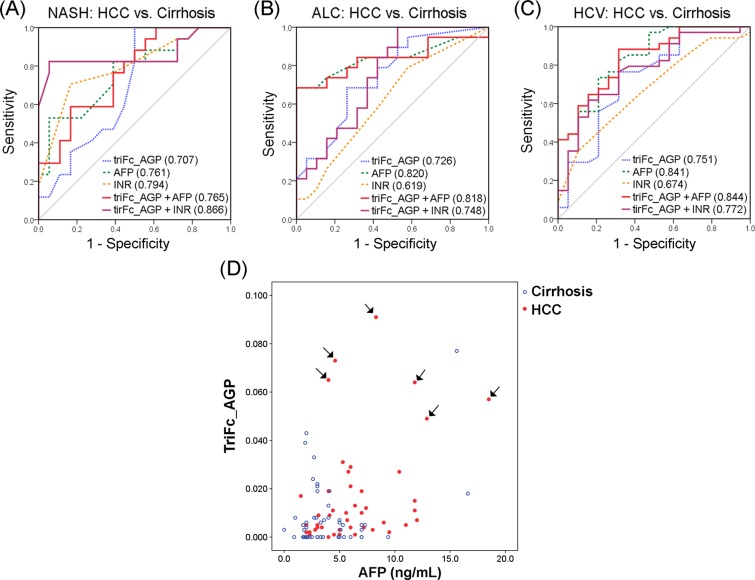
Figure 4.
(A–C) Combined ROC analysis between HCC and cirrhosis induced by NASH (A), ALC (B), and HCV (C), respectively (blue dash line, ROC curve of trifucosylation; green dash line, AFP; orange dash line, INR; red solid line, trifucosylated AGP and AFP combined; purple solid line, trifucosylated AGP and INR combined). (D) 2D scatter plot of the trifucosylation degree of serum AGP and the clinical AFP value in cirrhosis (blue) and HCC (red) patients with AFP < 20 ng/mL. Each spot represents an individual patient. HCC patients with negative AFP but high level of the trifucosylated AGP are marked with arrows.

