
Figure 2.
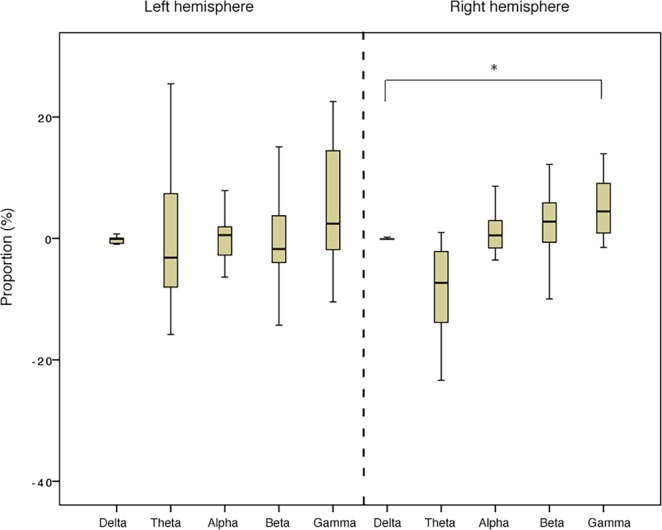
Wave median proportions of the total population in the right and in the left hemisphere in response to the “positive” voices V+ (Friedman test). *P < 0.05 (explanations can be found in the main text).
Official websites use .gov
A
.gov website belongs to an official
government organization in the United States.
Secure .gov websites use HTTPS
A lock (
) or https:// means you've safely
connected to the .gov website. Share sensitive
information only on official, secure websites.
Wave median proportions of the total population in the right and in the left hemisphere in response to the “positive” voices V+ (Friedman test). *P < 0.05 (explanations can be found in the main text).