
Figure 3.
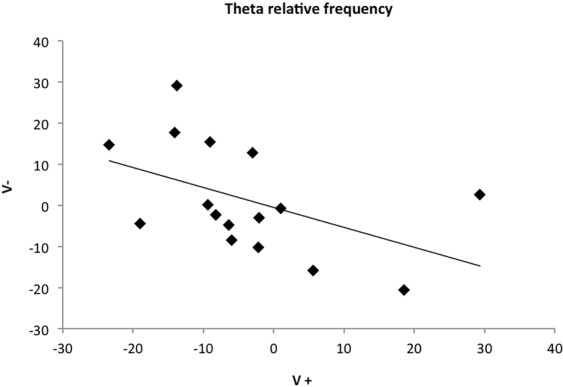
Theta wave relative frequency in % of the power profile (right hemisphere): correlation between data obtained for each horse during the playback of V+ and V− respectively.
Official websites use .gov
A
.gov website belongs to an official
government organization in the United States.
Secure .gov websites use HTTPS
A lock (
) or https:// means you've safely
connected to the .gov website. Share sensitive
information only on official, secure websites.
Theta wave relative frequency in % of the power profile (right hemisphere): correlation between data obtained for each horse during the playback of V+ and V− respectively.