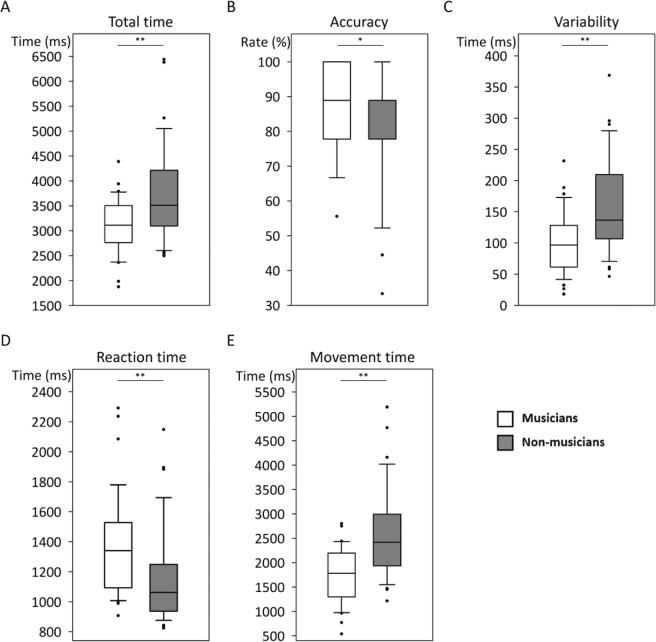
Figure 1.
Results of the finger sequence task in musicians and non-musicians. (A) Total time; (B) Accuracy; (C) Variability (standard deviation, SD); (D) Reaction time; (E) Movement time. Group data are shown in box plots: white indicates musicians; gray indicates non-musicians; upper to lower limit of the box: interquartile range (IQR); whiskers above and below the box: 1.5 × IQR; middle horizontal black line: median; individual data points: values exceeding 1.5 × IQR. *p < 0.05; **p < 0.005.

