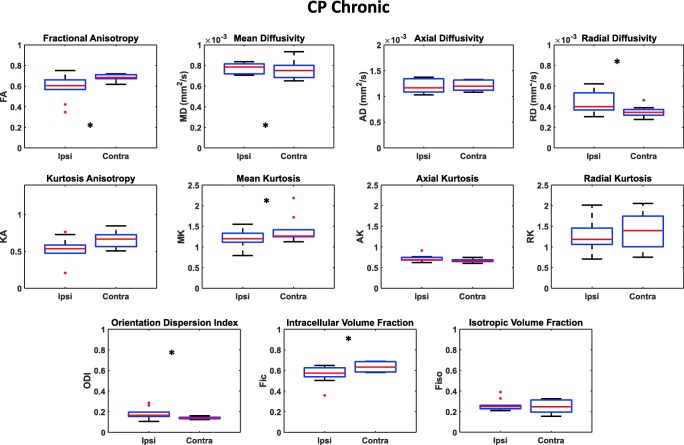
Fig. 7.
Box plots reporting DTI, DKI, and NODDI parameters calculated for the CP in the chronic phase in both the ipsilateral and contralateral hemisphere. Parameters values corresponding to each subject are displayed as red circles. Asterisks refer to the statistical significance of the difference between groups

