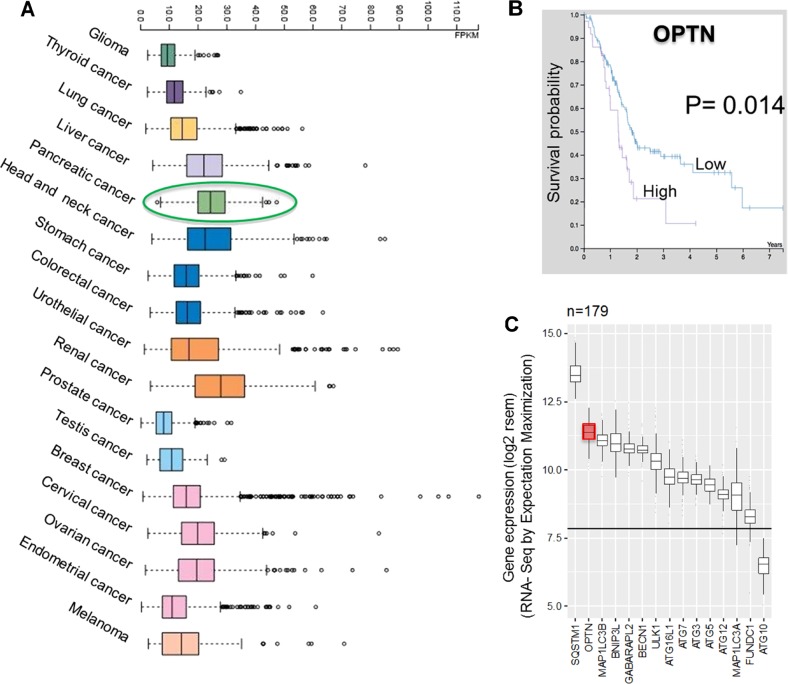
Fig. 2. OPTN expression from publically available human cancer data.
a Overview of the RNA-seq data in TCGA of 17 cancer cohorts showing the highest OPTN expression in renal cell carcinoma followed by PDAC (expressed in terms of median FPKM). b Kaplan–Meier curves of high and low OPTN expression in PDAC versus the survival of patients (log rank p-value (1.4e-2). Both a and b data were retrieved from human protein atlas (https://www.proteinatlas.org/ENSG00000123240-OPTN/pathology/tissue/pancreatic+cancer). c Expression of autophagy related genes and receptors in the PDAC cell cohort with a sample size of 179 patients. The mean control expression is indicated by the straight line across all groups. All expression levels shown are >7.5 log2 rsem (Rna-Seq by Expectation Maximization)

