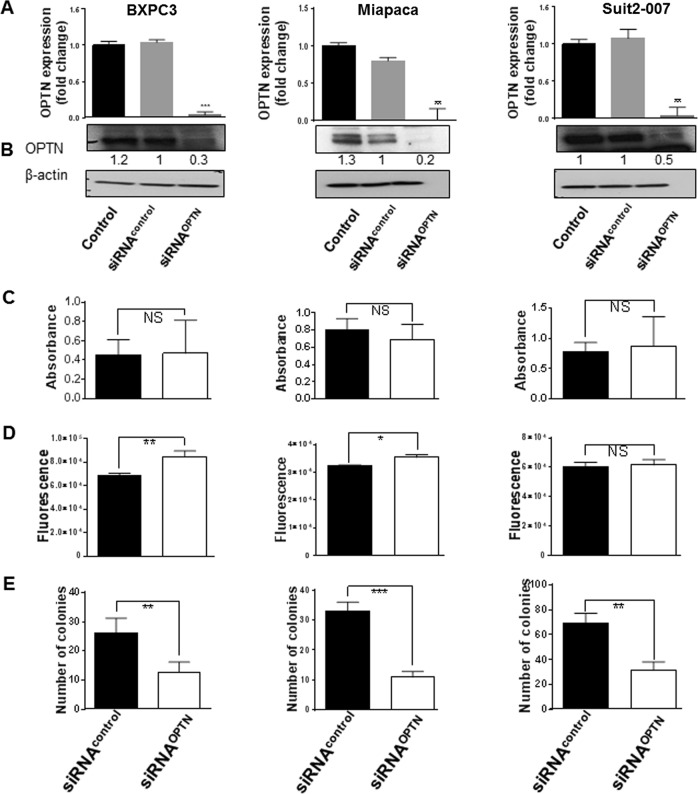
Fig. 3. Effect of OPTN knockdown on PDAC cellular functions.
The three columns represent results from BXPC3 (left), Miapaca (middle) and Suit2-007 (right). a, b mRNA and protein expression of OPTN in three pancreatic cell lines determined by qRT-PCR and WB at 48 h post siRNA transfection. All specific knockdown samples were compared with untreated and treated controls. Samples were normalized to GAPDH for qRT-PCR and to β-actin for WB. Calculation for qRT-PCR was done using the ΔΔCT method and imageJ was used to measure band densities for western blot. c Cytotoxic effect of OPTN silencing on three pancreatic cancer cell lines post transfection with the MTT assay. Absorbance was measured at 540 nm wavelength with a reference of 690 nm. d Migration assay showing the number of migrating cells following transfection using a transwell 2 compartment model that was determined by cell titer blue (Excitation 560/15 and Emission 590/ 20). The assays were done in triplicate and the results represent their average. e Colony formation assay was started at 48 h post transfection and shows the number of colonies as well as that of the nonspecific control after 7–10 days. The assay was done in quadruplicate and the data represent the respective average with standard deviation. Statistical analysis for all tests was done with Student’s t-test and one way Anova with p values ≤ 0.05 considered significant. *p < 0.01, **p < 0.001, ***p < 0.0001

