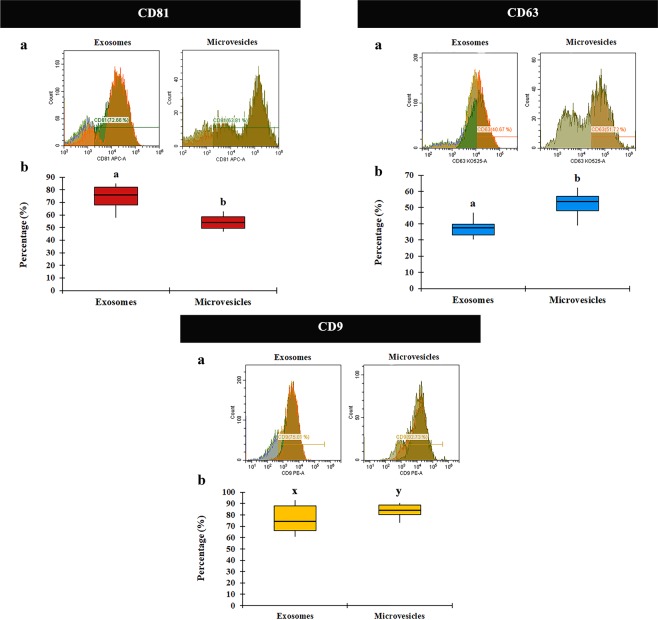
Figure 5.
Flow cytometric analysis of tetraspanin CD81, CD63 and CD9 expression in extracellular vesicles (EVs) subtypes isolated from pig seminal plasma. (a) Histogram representative of CD81/CD63/CD9 expression in EV subtypes (exosomes and microvesicles). Fluorescence (CD81-APC-A, CD63-KO525-A and CD9-PE, x-axis), vs number of events (Count, y-axis). (b) Box-whisker plot showing variation in CD81/CD63/CD9 expression between EV subtypes of 12 ejaculates (one per boar). Boxes enclose the 25th and 75th percentiles; the line is the median; and the whiskers extend to the 5th and 95th percentiles. (a,b) and (x–y) indicate significant differences (P < 0.001 and P < 0.05, respectively) among the EV subtypes.

